Introduction
This post will discuss how you can capture and display your sensor data in almost real-time using WebSockets. Part of the challenges in any Internet of Things (IoT) project is how you can capture your sensor values and visualize them using charts for display. We are going to build our own custom dashboard application with charts built using a full stack application that we created using Node.js and React.js that will display our sensor data sent thru WebSockets.
There are lots of IoT cloud platforms that let you do this out of the box like ThingSpeak, Arduino Cloud, or from big-time companies such as Amazon, Google, Microsoft, or Oracle et al. We are going to create our own application so that we are not limited by some of the restrictions of these IoT cloud provider. In the future, we will be exploring these IoT cloud platforms but in the meantime, we are going to create our own custom applications that will do this. Please see the following video for demo purposes or watch it on my YouTube channel.
I won’t be discussing so much about what WebSockets is but if you are interested in how it works then check out the link below. I have fairly discussed how WebSockets works and why this is considered a good communication protocol if you need a real-time response.
Related Content:
Using WebSocket in the Internet of Things (IoT) projects
How to display sensor reads using WebSockets?
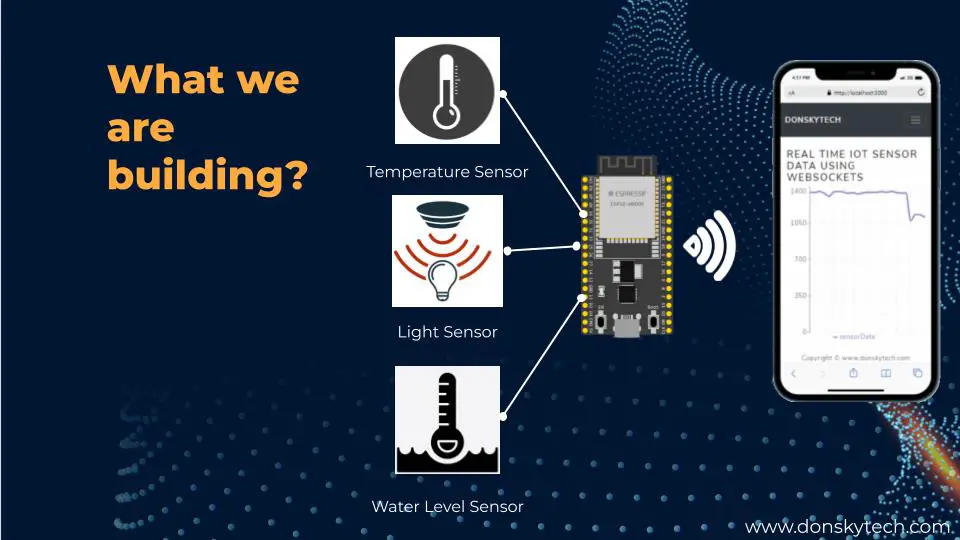
Sensors are used in situations like getting the current temperature, humidity, or pressure. It could even be used to detect the presence or absence of light or the water level in tanks or dams. The value that the sensor could read could change instantaneously like what the Photoresistor or a Light Dependent Resistor detects.
If there is a sudden change in sensor values that we could easily see thru a dashboard graph then we could react immediately.
In our earlier post, I detailed how we can read the values of an LDR using an ESP32 microcontroller. This sensor is ideal for our current project as the values could be altered easily by just changing the amount of light captured by the LDR. So in this project, the challenge that we are going to solve is how to read the sensor data and be able to display it in real time. This is where WebSockets comes into the picture.
How do we send data to our server?
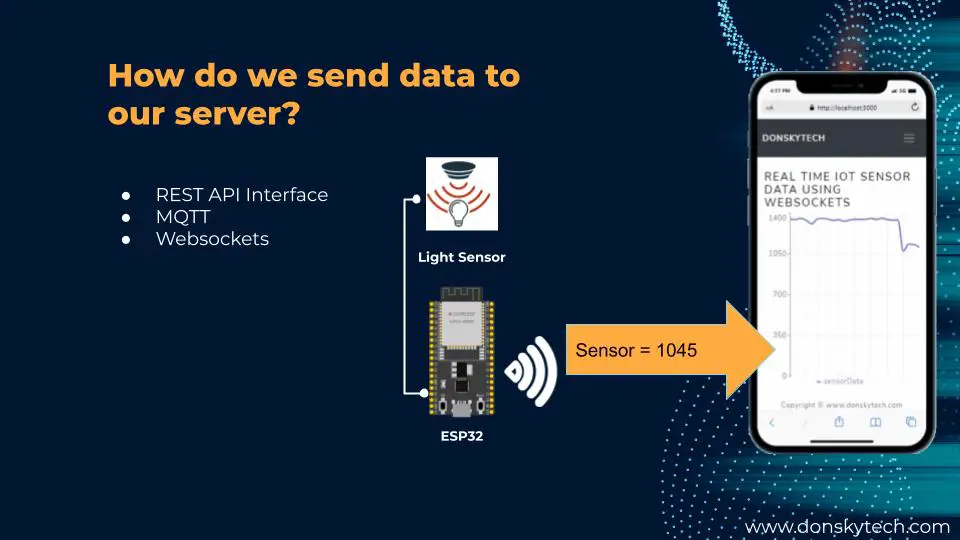
Now the next thing to take a look at is how we send the sensor read into our server. If our LDR would read 1045 then how can we transfer that data to our server? There are other communication protocols that we can use to send our sensor reads to our server. I have listed three options like the
- REST API Interface
- MQTT
- Websockets
REST API Interface
This option will allow us to send our data by calling a particular endpoint exposed by our target server. Take for example how we can use ThingSpeak API in this link (https://www.mathworks.com/help/thingspeak/writedata.html)
To write our sensor data to our server we typically send an HTTP request to their endpoint like this
The only downside that I could think of when using our REST API Interface is the amount of overhead in sending our sensor reads. If our goal is to send it in real time then we might encounter some buffering issues especially if the client is far from our server. But if our sensor read does not change instantaneously like temperature then this could be a viable alternative.
MQTT
MQTT or MQ Telemetry Transport (https://en.wikipedia.org/wiki/MQTT) is a publish-subscribe communication protocol where a middleman or the MQTT server handles the sending or receiving of the message. The message is sent using binary data packets and is ideal for scenarios where resource or network bandwidth data is constrained. We will be using this in a future post so stay tuned.
Websockets
Websockets is a communication protocol that allows full duplex communication where the server or the client(s) can send messages almost in real-time. The primary advantage of WebSockets is its low latency compared to the REST API interface. I was able to control the direction of my smart robot car using WebSockets in a previous post. If for some reason there is a “delay” or “lag” or “latency” in sending or receiving messages then our car would crash. I have detailed how WebSockets works in that post as well so you can read into that.
Websockets Server System Design
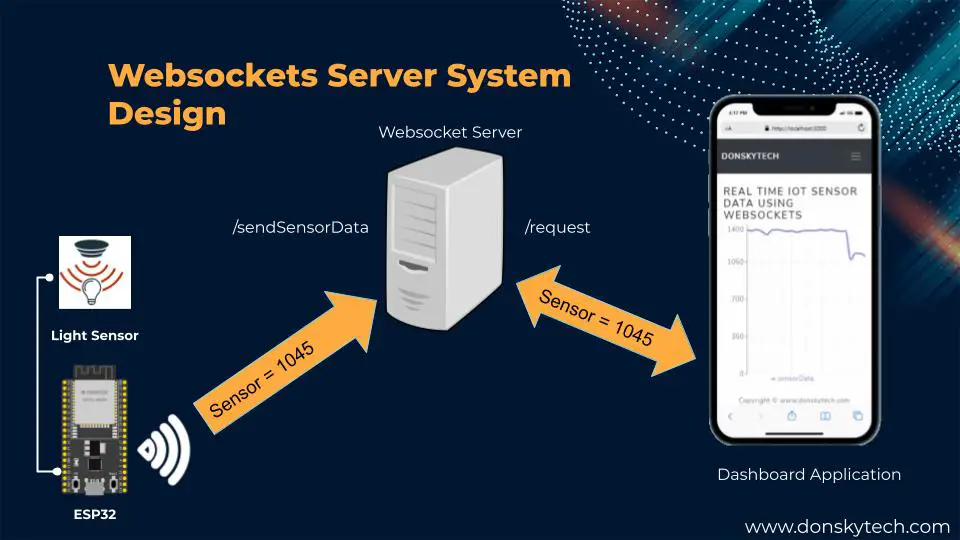
The following is the high-level system design of our Websockets server that will handle the sensor reads and displays. There are 3 major components in our system.
- ESP32 Dev Module + Sensor
- Websockets Server
- Dashboard Application
ESP32 Dev Module + Sensor
The ESP32 Dev module reads the values of the LDR and sends the data back to our WebSocket server. Our ESP32 Dev board opens up a WebSocket connection to our WebSocket server. It sends the sensor reads by calling a particular path in our WebSocket server which is detailed in the next section.
Websockets Server
Our Websocket server serves as the backend of our application. It has two primary purposes and the first one is to retrieve the sensor read. The second one is to send that sensor reads to all clients connected to it. This is built using Node.js javascript runtime.
The Websocket server is exposing two different paths listed as
- /sendSensorData
- /request
The “/sendSensorData” path is what our ESP32 client will use to send the sensor reads. In our case here, we are using an ESP32 Dev board connected to an LDR/Photoresistor that transmits the sensor reads. If we have our WebSocket server running on IP 192.1.1.1 and listening at port 8080 then this translates to the following path “ws://192.1.1.1:8080/sendSensorData“
The “/request” path is what our dashboard application will use to communicate with our WebSocket server. Sensor reads that are received by the WebSocket servers are sent to this path. The complete path is then ws://192.1.1.1:8080/request if the server IP is 192.1.1.1 and listening at port 8080.
Dashboard Application
The dashboard application displays the sensor read being sent by the WebSocket server using a line graph on a near “real-time” basis. This is the front of our project which we have used React.js in building this application. This is the component of our project that will display the sensor reads using a WebSockets connection.
Now so much for the theory part so let us get down to coding the application!
Where is the code on how to display sensor read using WebSockets?
Websocket Server/Dashboard Application
The code for the WebSocket server and the dashboard application is in my GitHub account repository at this link. You can either download it as a zip file and unzip it in any of your directories or clone it using the git command.
git clone https://github.com/donskytech/react-projects.git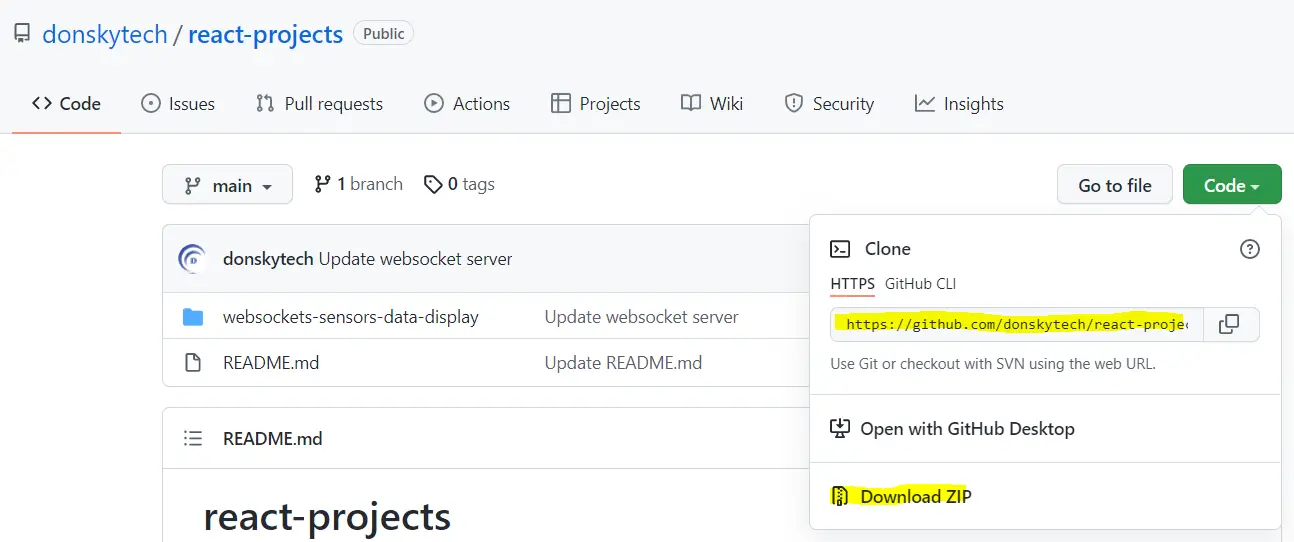
Now open the project using Visual Studio Code. In order to run this project then you need to install Node.js first on your machine. My earlier article discussed how to do this if you are using Windows/PC.
You need to install all the dependencies first before you could run the application. The steps are in the README.MD of my application. You can open a terminal if you are in Mac or Linux or a command prompt if you are on a PC/Windows. This might take a while depending on your network speed.
cd react-projects/websockets-sensors-data-display
npm install
cd frontend
npm install
cd ..
Execute the following commands to run the application.
npm run devHere is a screenshot detailing the sample run of my application when you execute the above steps.
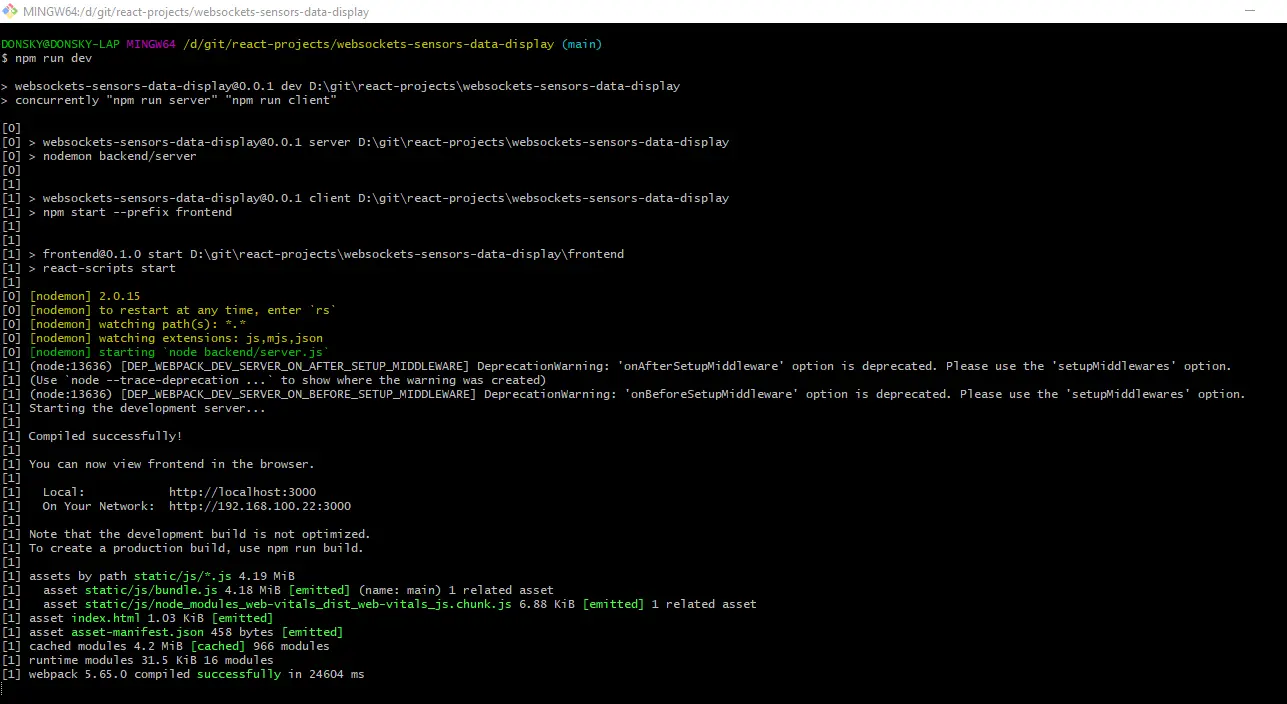
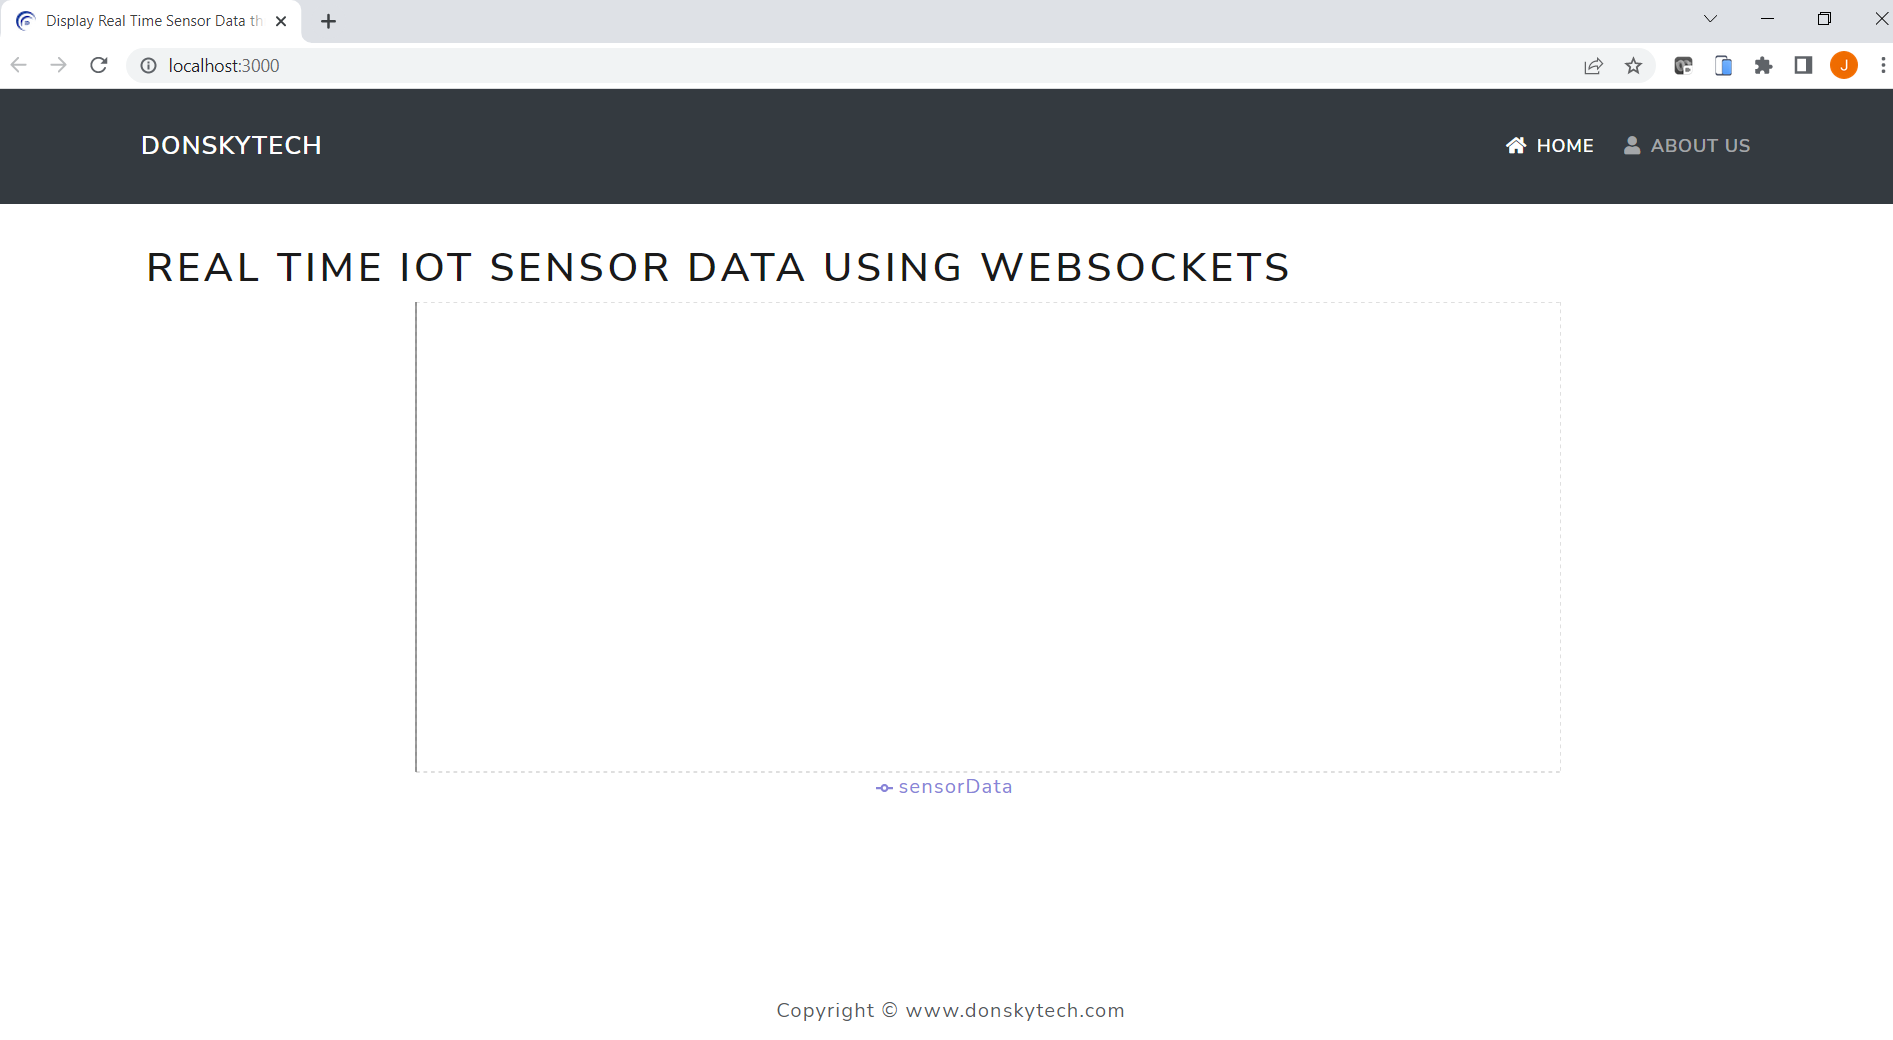
The dashboard application would then open at this endpoint “http://localhost:3000/” if no errors were encountered. We have not yet connected our ESP32 dev module with the LDR connected but congratulations as you now have successfully run the application.
I will not be discussing so much about how to build from scratch this project as Node.js and React.js is a huge projects in themselves but I will try to explain the important parts.
The backend and frontend directory subdivides our project when you open it in Visual Studio Code. The backend handles the WebSockets port connection handling while the frontend will display the sensor read.
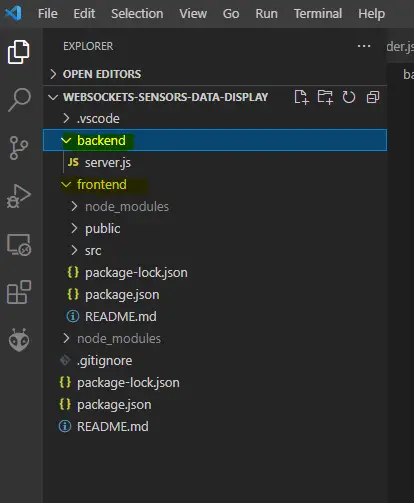
The server.js is the meat of our backend application. This is where the WebSockets server is defined that will receive the sensor reads and send them to the dashboard application for display. You can see the code here for your viewing but for your reference, I have heavily commented on it if you would like to take a look further.
import { createServer } from "http";
import { parse } from "url";
import { WebSocketServer } from "ws";

// Create the https server
const server = createServer();
// Create two instance of the websocket server
const wss1 = new WebSocketServer({ noServer: true });
const wss2 = new WebSocketServer({ noServer: true });

// Take note of client or users connected
const users = new Set();

/*For the first connection "/request" path
 We take note of the clients that initiated connection and saved it in our list
 */
wss1.on("connection", function connection(socket) {
  console.log("wss1:: User connected");
  const userRef = {
    socket: socket,
    connectionDate: Date.now(),
  };
  console.log("Adding to set");
  users.add(userRef);
});

/*
 For the second connection "/sendSensorData" path
 This is where we received the sensor reads from the ESP32 Dev module.
 Upon receiving the sensor read, we broadcast it to all the client listener
*/
wss2.on("connection", function connection(ws) {
  console.log("wss2:: socket connection ");
  ws.on('message', function message(data) {
      const now = Date.now();

      const parseData = JSON.parse(data);
      let message = { date: now, sensorData: parseData.value };
      const jsonMessage = JSON.stringify(message);
      sendMessage(jsonMessage);
  });
});


/*
This is the part where we create the two paths.
Initial connection is on HTTP but is upgraded to websockets
The two path "/request" and "/sendSensorData" is defined here
*/
server.on("upgrade", function upgrade(request, socket, head) {
  const { pathname } = parse(request.url);
  console.log(`Path name ${pathname}`);

  if (pathname === "/request") {
    wss1.handleUpgrade(request, socket, head, function done(ws) {
      wss1.emit("connection", ws, request);
    });
  } else if (pathname === "/sendSensorData") {
    wss2.handleUpgrade(request, socket, head, function done(ws) {
      wss2.emit("connection", ws, request);
    });
  } else {
    socket.destroy();
  }
});

server.listen(8080);

const sendMessage = (message) => {
  // console.log("Sending messages to users!");
  for (const user of users) {
    user.socket.send(message);
  }
};
The frontend directory contains the code for our dashboard application. If you have some experience in React.js then this could be familiar to you. If not then I will try my best to explain the important parts of this frontend application. The SensorDataChart.js contains all the logic to display the sensor reads in our applications.
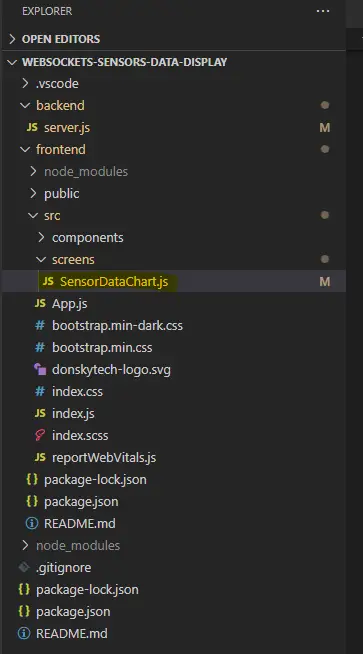
I have commented on this file as much as possible for you to understand its logic. If you have any doubts then please feel free to send me a message on any of my social media channels. I will try my best to answer them.
import React, { useEffect, useRef, useState } from "react";
import {
  LineChart,
  Line,
  YAxis,
  CartesianGrid,
  Tooltip,
  Legend,
  ResponsiveContainer,
} from "recharts";
import { Row, Container } from "react-bootstrap";

const SensorChart = () => {
  const ws = useRef();
  const [data, setData] = useState([]);

  useEffect(() => {
    //Send request to our websocket server using the "/request" path
    ws.current = new WebSocket("ws://localhost:8080/request");

    ws.current.onmessage = (ev) => {
      const message = JSON.parse(ev.data);
      console.log(`Received message :: ${message.sensorData}`);
      // Upon receiving websocket message then add it to the list of data that we are displaying
      let newDataArray = [
        ...data,
        {
          id: message.date,
          sensorData: message.sensorData,
        },
      ];
      console.log(newDataArray);
      setData((currentData) => limitData(currentData, message));
    };
    ws.current.onclose = (ev) => {
      console.log("Client socket close!");
    };

    //We limit the number of reads to the last 24 reading and drop the last read
    function limitData(currentData, message) {
      if (currentData.length > 24) {
        console.log("Limit reached, dropping first record!");
        currentData.shift();
      }
      return [
        ...currentData,
        {
          id: message.date,
          sensorData: message.sensorData,
        },
      ];
    }

    return () => {
      console.log("Cleaning up! ");
      ws.current.close();
    };
  }, []);

  //Display the chart using rechart.js
  return (
    <Container className="p-3">
      <Row className="justify-content-md-center">
        <h1 className="header">Real time IOT Sensor Data Using Websockets</h1>
      </Row>
      <Row className="justify-content-md-center">
        <div style={{ width: 1000, height: 400 }}>
          <ResponsiveContainer>
            <LineChart
              width={800}
              height={400}
              data={data}
              margin={{
                top: 0,
                right: 0,
                left: 0,
                bottom: 0,
              }}
            >
              <CartesianGrid strokeDasharray="3 3" />
              {/* <XAxis dataKey="date" /> */}
              <YAxis />
              <Tooltip />
              <Legend />
              <Line
                type="monotone"
                dataKey="sensorData"
                stroke="#8884d8"
                activeDot={{ r: 24 }}
                strokeWidth="4"
              />
              {/* <Line type="monotone" dataKey="uv" stroke="#82ca9d" /> */}
            </LineChart>
          </ResponsiveContainer>
        </div>
      </Row>
    </Container>
  );
};

export default SensorChart;
And that’s it for the frontend and backend applications that will handle the WebSockets connections and the display of the sensor reads. We will now go to the ESP32 project that reads the LDR sensor read and send it to our WebSockets server for display. Let’s get going!
ESP32 Dev Module
The code that will read the LDR sensor read is in this link. You can either download it as a zip or git clone it using the following command.
git clone https://github.com/donskytech/platformio-projects.git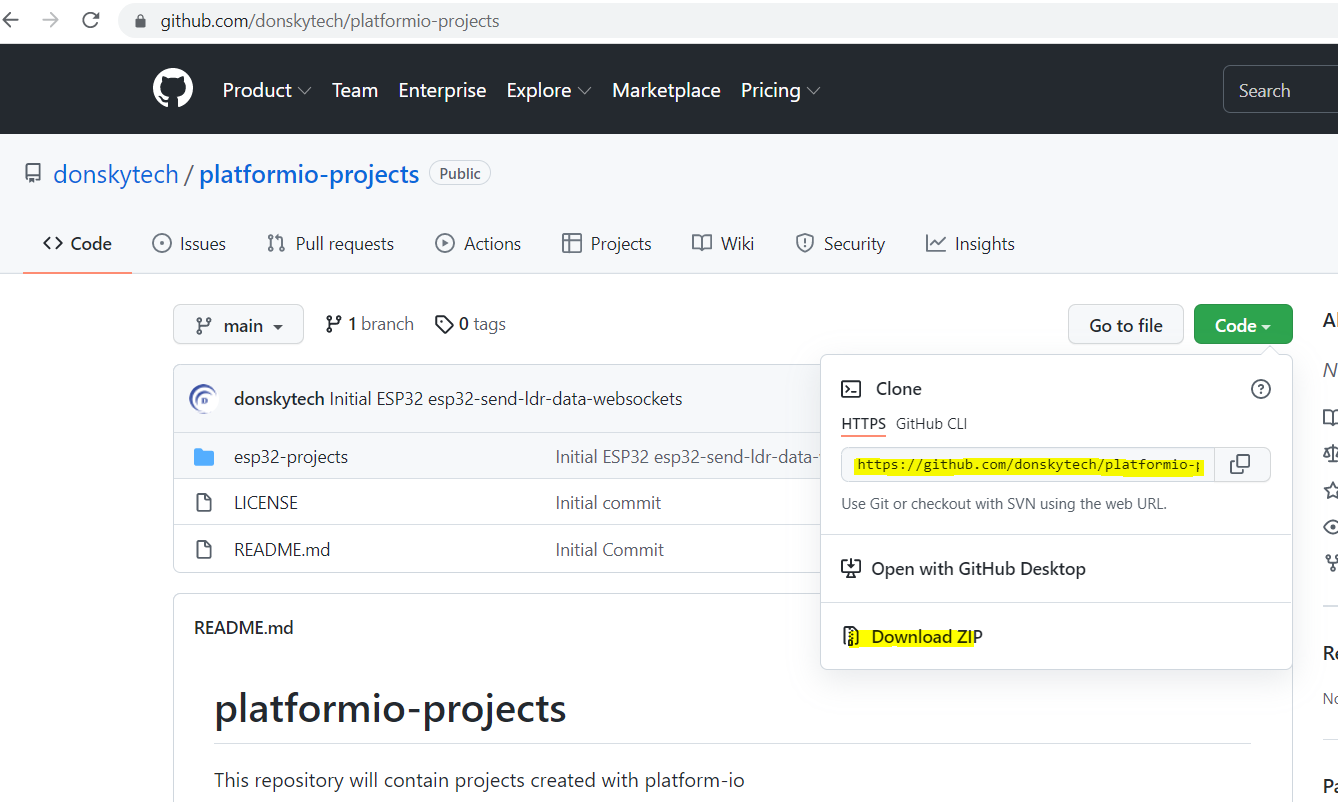
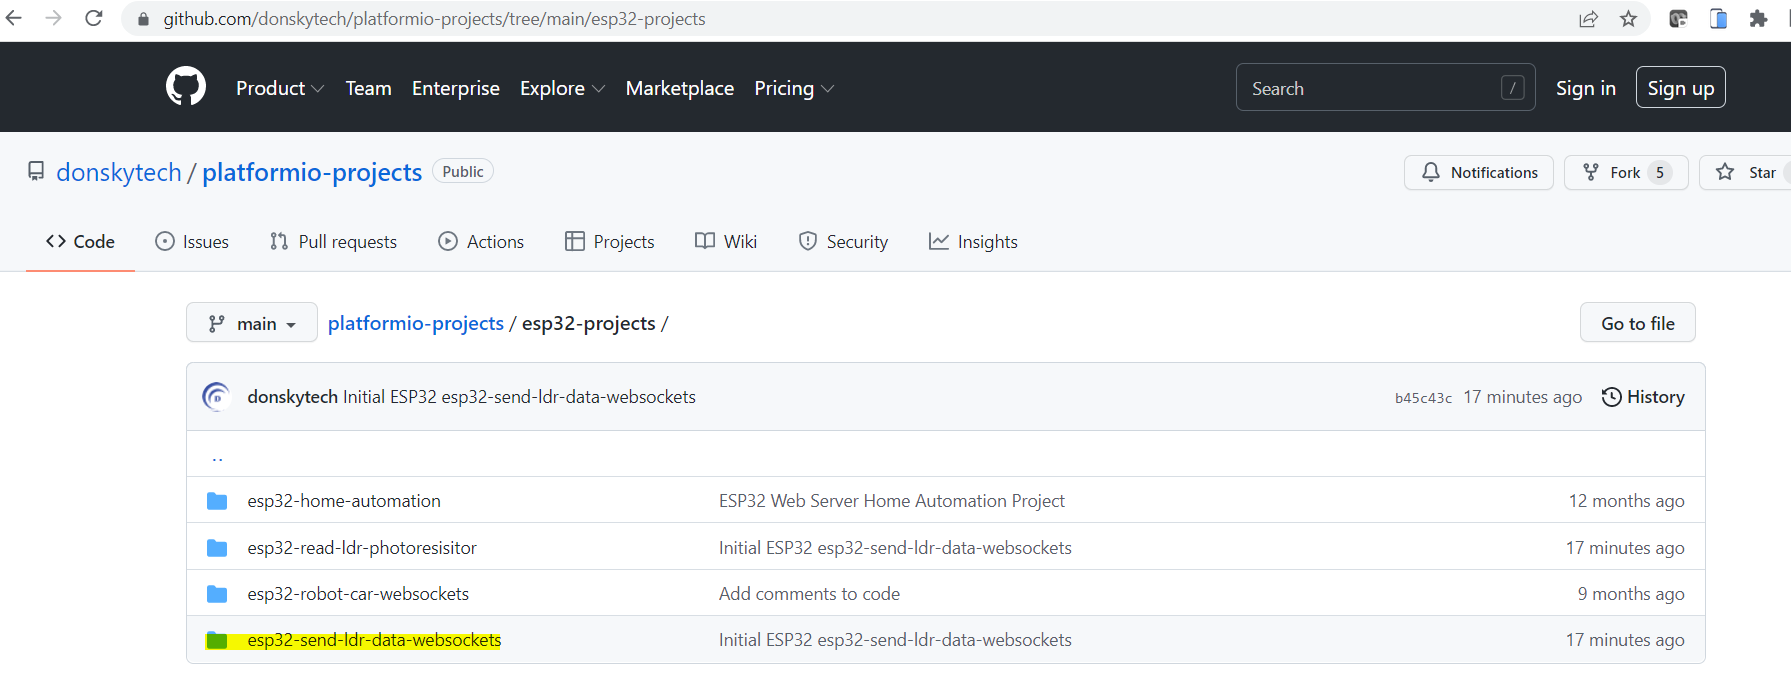
My platformio-projects/esp32-projects contains the directory named esp32-send-ldr-data-websockets. We used the Arduino framework in programming this application.
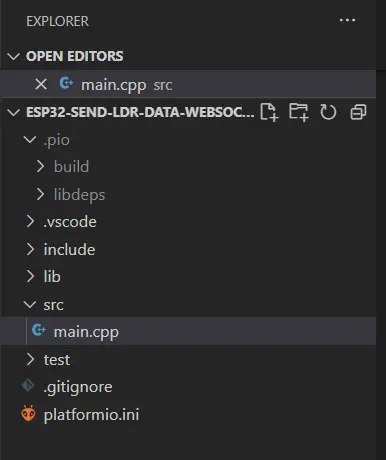
If you open the code in Visual Studio then you would notice that it only contains one file which is the main.cpp.
If you open the platform.ini file then you would see that I am using two libraries as my dependencies. The first one is the library we use to communicate with our WebSockets server while the second one is used to format our WebSockets messages.
- https://github.com/Links2004/arduinoWebSockets.git
- https://github.com/bblanchon/ArduinoJson.git
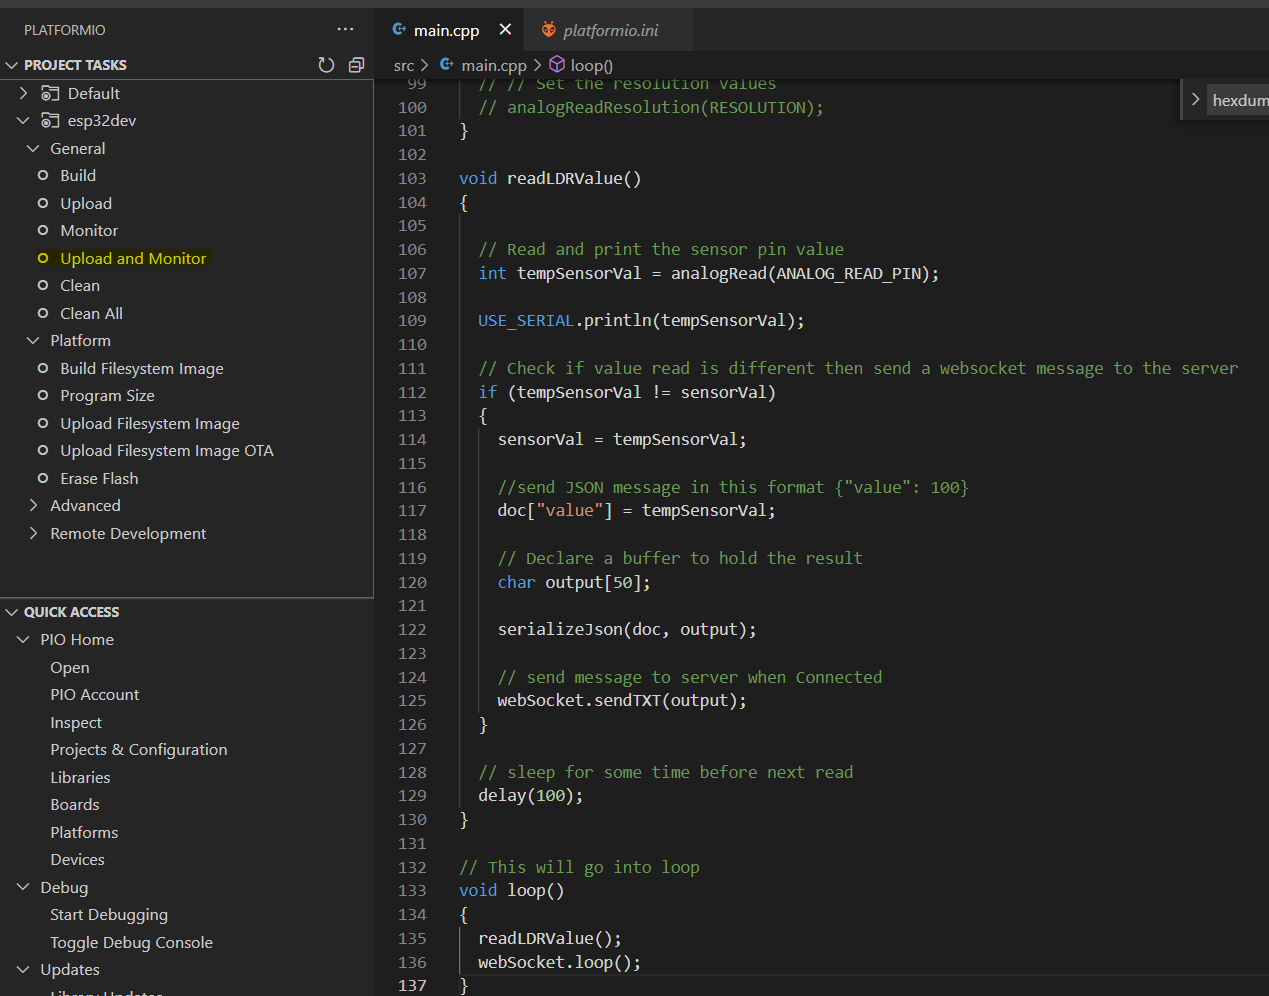
The main.cpp file embeds the whole logic of sending WebSockets messages. I have fairly documented each step for your reference. Do take note that you need to change lines 24 and 25 and use your own wifi SSID/Password.
/*
 * main.cpp
 *
 *  Created on: Apr 15, 2022
 *  Created By: donskytech
 *
 */

#include <Arduino.h>
#include <WiFi.h>
#include <WiFiMulti.h>
#include <WiFiClientSecure.h>
#include <WebSocketsClient.h>
#include <ArduinoJson.h>

WiFiMulti WiFiMulti;
WebSocketsClient webSocket;

static int sensorVal = 0;
const int ANALOG_READ_PIN = 36; // or A0
const int RESOLUTION = 12;      // Could be 9-12

// CHANGE THIS TO ADD YOUR WIFI USERNAME/PASSWORD
const char * WIFI_SSID = "donsky";
const char * WIFI_PASS = "donsky123";

//Initialize the JSON data we send to our websocket server
const int capacity = JSON_OBJECT_SIZE(3);
StaticJsonDocument<capacity> doc;

#define USE_SERIAL Serial

void webSocketEvent(WStype_t type, uint8_t *payload, size_t length)
{

  switch (type)
  {
  case WStype_DISCONNECTED:
    USE_SERIAL.printf("[WSc] Disconnected!\n");
    break;
  case WStype_CONNECTED:
    USE_SERIAL.printf("[WSc] Connected to url: %s\n", payload);
    break;
  case WStype_TEXT:
    USE_SERIAL.printf("[WSc] get text: %s\n", payload);
    break;
  case WStype_BIN:
    USE_SERIAL.printf("[WSc] get binary length: %u\n", length);
    break;
  case WStype_ERROR:
  case WStype_FRAGMENT_TEXT_START:
  case WStype_FRAGMENT_BIN_START:
  case WStype_FRAGMENT:
  case WStype_FRAGMENT_FIN:
  case WStype_PING:
  case WStype_PONG:
    break;
  }
}

void setup()
{
  //Set the baud rate
  USE_SERIAL.begin(115200);
  USE_SERIAL.printf("Begin websocket client program....");

  USE_SERIAL.println();

  for (uint8_t t = 4; t > 0; t--)
  {
    USE_SERIAL.printf("[SETUP] BOOT WAIT %d...\n", t);
    USE_SERIAL.flush();
    delay(1000);
  }

  WiFiMulti.addAP(WIFI_SSID, WIFI_PASS);

  // WiFi.disconnect();
  USE_SERIAL.printf("Connecting");
  while (WiFiMulti.run() != WL_CONNECTED)
  {
    USE_SERIAL.printf(".");
    delay(100);
  }
  USE_SERIAL.printf("Connected!");

  // server address, port and URL
  webSocket.begin("192.168.100.22", 8080, "/sendSensorData");

  // event handler
  webSocket.onEvent(webSocketEvent);

  // use HTTP Basic Authorization this is optional remove if not needed
  // webSocket.setAuthorization("user", "Password");

  // try ever 5000 again if connection has failed
  webSocket.setReconnectInterval(5000);

  // // Set the resolution values
  // analogReadResolution(RESOLUTION);
}

void readLDRValue()
{

  // Read and print the sensor pin value
  int tempSensorVal = analogRead(ANALOG_READ_PIN);

  USE_SERIAL.println(tempSensorVal);

  // Check if value read is different then send a websocket message to the server
  if (tempSensorVal != sensorVal)
  {
    sensorVal = tempSensorVal;

    //send JSON message in this format {"value": 100}
    doc["value"] = tempSensorVal;

    // Declare a buffer to hold the result
    char output[50];

    serializeJson(doc, output);

    // send message to server when Connected
    webSocket.sendTXT(output);
  }

  // sleep for some time before next read
  delay(100);
}

// This will go into loop
void loop()
{
  readLDRValue();
  webSocket.loop();
}
The important part is in the readLDRValue() function where we read the values from the LDR/Photoresistor. We format it as JSON messages and send them to the WebSockets.
The loop() function will continually read the LDR and periodically send this message to the WebSocket server. Once you understood how the code works then Upload it to your ESP32 memory using the PlatformIO upload command.
The ESP32 WebSockets client would then connect to our Node.js WebSockets server after some time. It would then send the sensor reads to our dashboard application for display.
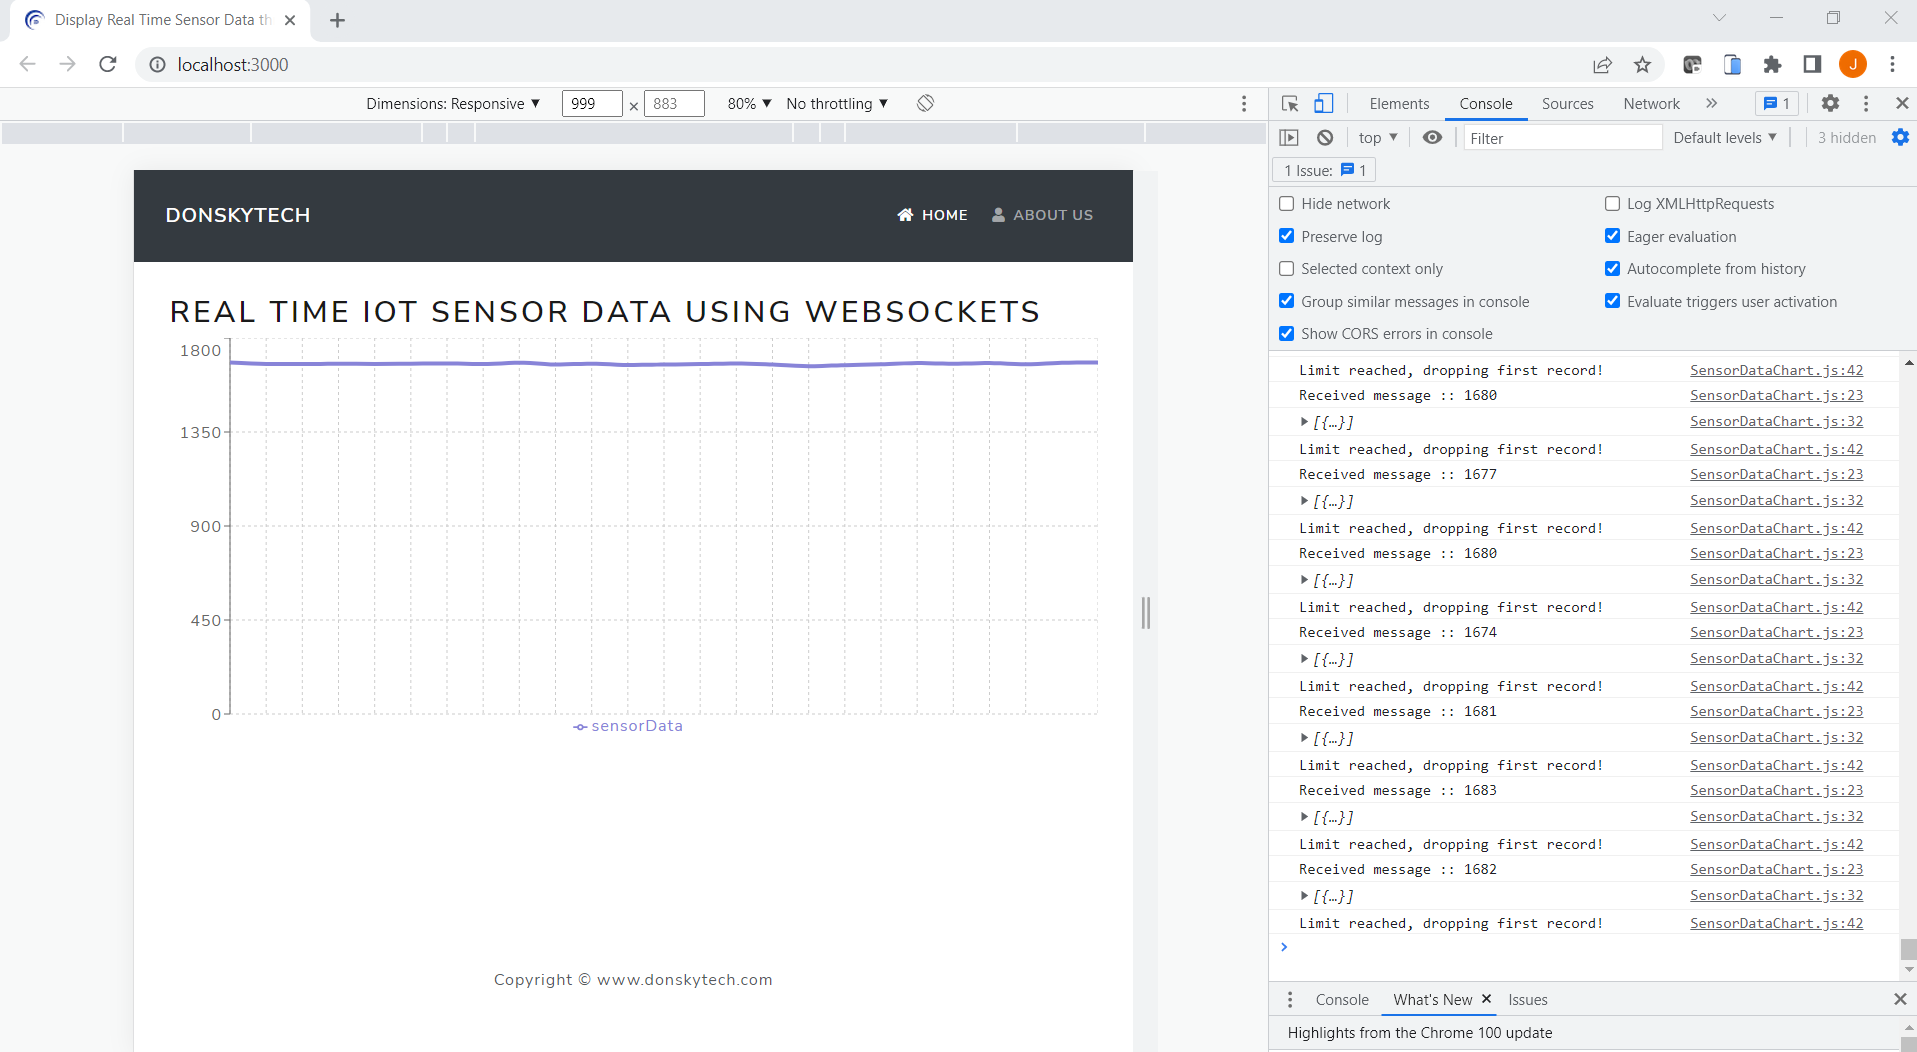
Viewing the WebSockets message from the LDR/Photoresistor
If you want to view the WebSockets messages received by our dashboard application, open the developer tools in your browser. I am using Google Chrome so I can just click F12 on my windows/pc machine and it will show. In the console tab, you would see the logs of my WebSockets messages.
Summary
We have learned about WebSockets servers, clients, and messages and how to build them using Node.js and React.js. We have created our own custom dashboard application with charts that would display our sensor readings in almost real time. Also, I have shown how to send WebSocket messages coming from your ESP32 microcontroller.
I hope you have learned something from this simple project as I had fun building this.
That’s it!
Happy Exploring!
Leave a Reply