Introduction
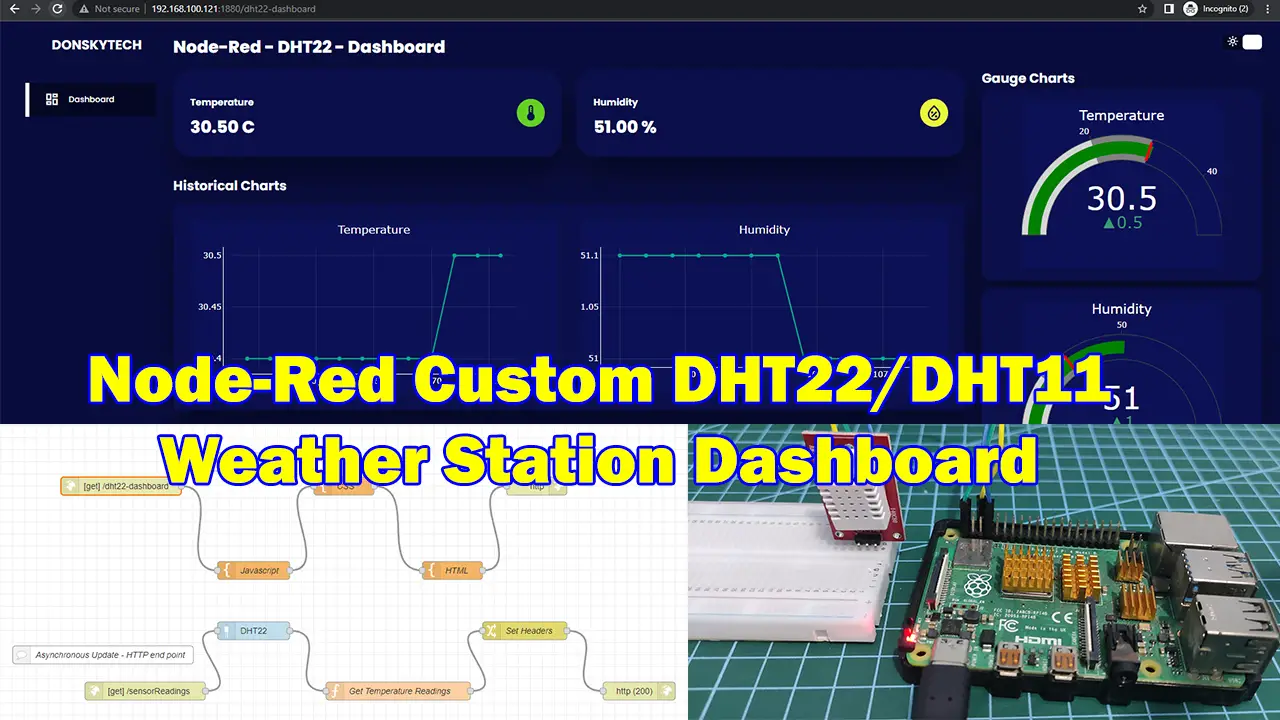
This post will show you how I created my own custom Node-Red dashboard that will display the sensor readings of my DHT22/DHT11 sensor in real-time. The page will asynchronously update itself using Javascript to display the latest sensor reads.
If you want to see a demo of this project in video format then please see below or watch it on my YouTube channel.
Design
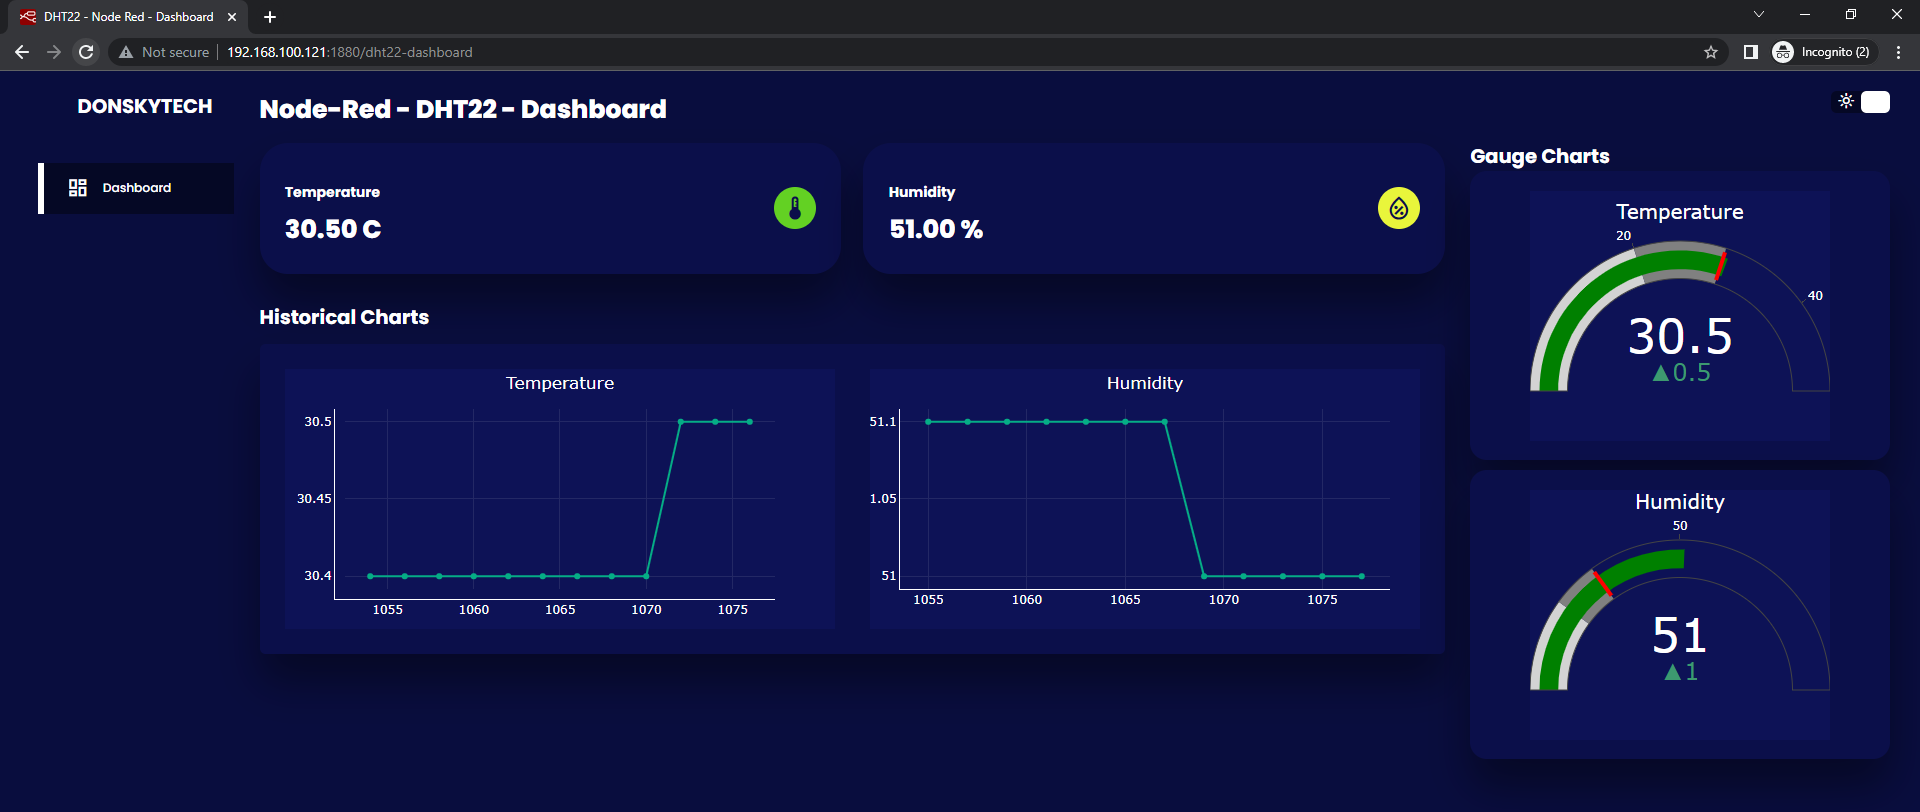
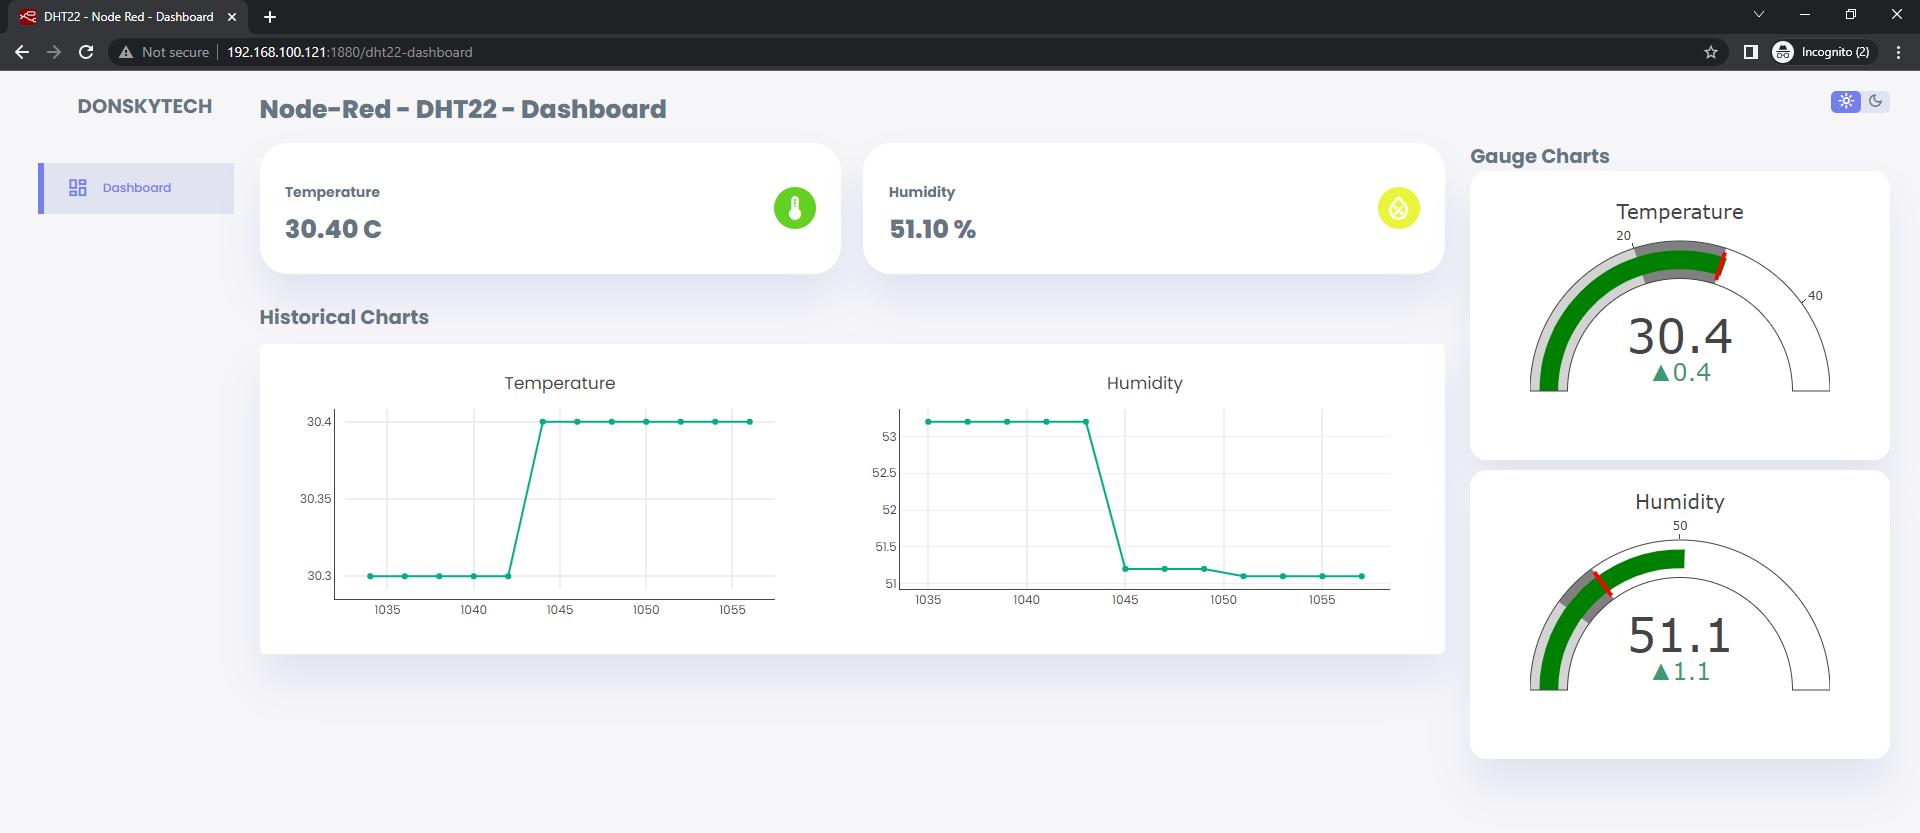
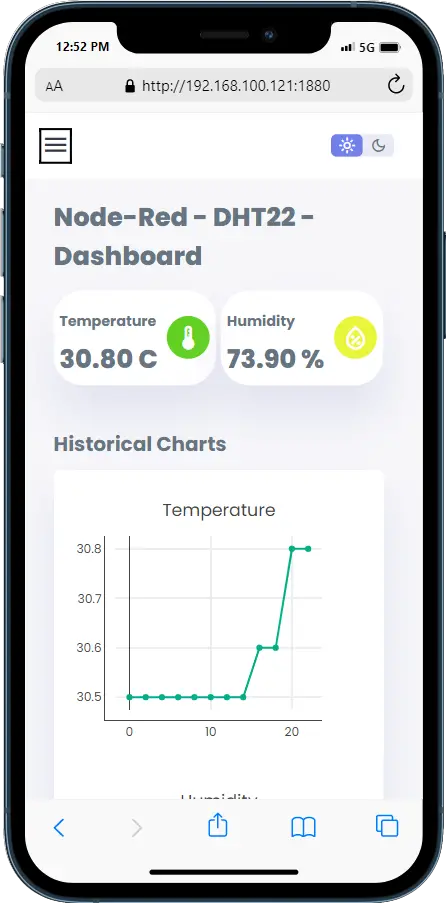
Below are the images of how our custom Node-Red Dashboard will look while reading a DHT22/DHT11 sensor in almost real time. To do this project requires some knowledge about HTML/CSS/Javascript and how HTTP works. It also needs some knowledge about Plotly.js in developing graphical charts to display your sensor readings.
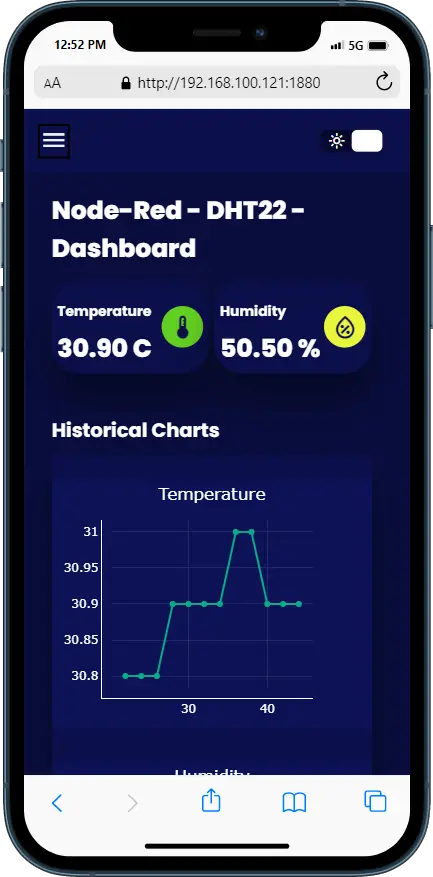
The user interface comes in a dark and light theme and is responsive to mobile devices to display the user interface.
Why I created my custom dashboard?
I was looking at the Node-Red Dashboard module and I was able to create my own simple user interface. However, I had some difficulty changing the stylesheet or maybe I am just not well versed yet with Node-Red so I decided to roll on with my own custom solution.
Node-Red is an easy tool to wire up all of the components needed for you to create your own Internet of Things (IoT) solution.
Prerequisites
You should have access to a working Node-Red application. I have used Raspberry Pi with the latest Raspberry Pi OS installed in this post. At the same time, I installed the Node-Red application on the same device.
Related Content:
How to install Node-Red on Raspberry Pi
Setup Raspberry Pi Headless No Monitor
Components/Parts
The following are the components required for this post.
- Raspberry Pi 4B – Amazon | AliExpress
- DHT22 – Amazon | AliExpress
- or DHT11 – Amazon | AliExpress | Bangood
- Breadboard – Amazon | AliExpress | Bangood
- Connecting Wires – Amazon | AliExpress | Bangood
Disclosure: These are affiliate links and I will earn small commissions to support my site when you buy through these links.
Wiring/Schematic
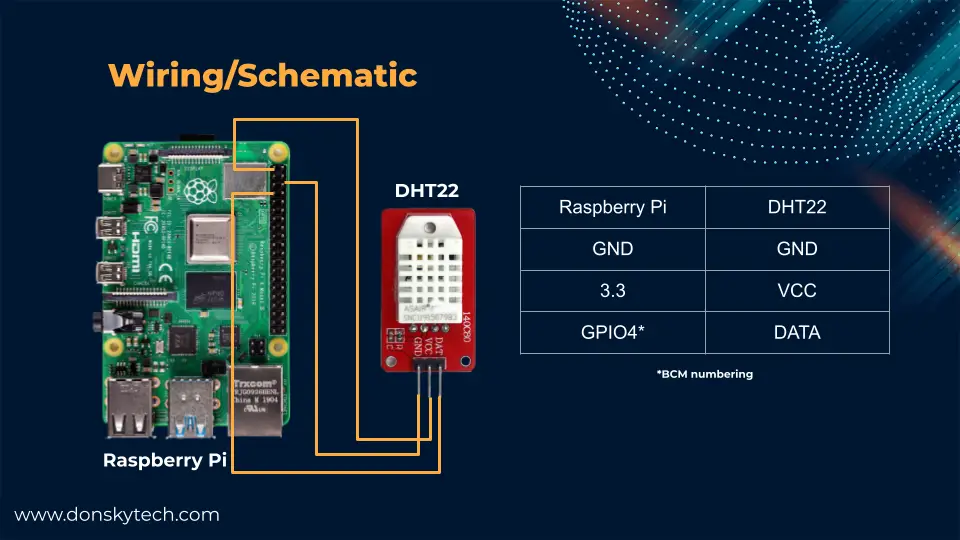
The image above is the wiring and schematic diagram for this project. You can replace the DHT22 with the DHT11 if that is the sensor you have.
Node-Red Flow
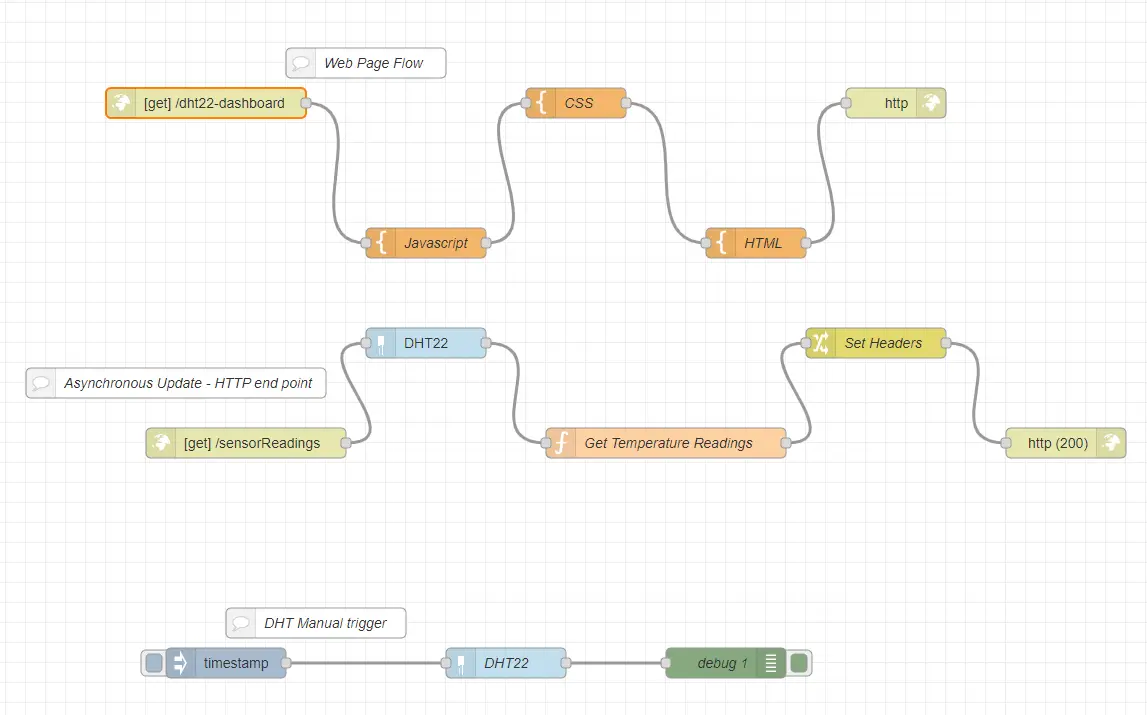
The image above is the nodes associated with our Node-Red DHT22/DHT11 Custom Dashboard flow. It consists of the following sections:
- Web Page flow – This flow will show our custom dashboard page and consists of template nodes with the HMTL/CSS/Javascript code.
- Asynchronous HTTP endpoint flow – This flow will respond to an HTTP request “/sensorReadings” and will read our DHT22 node and return a JSON response
- DHT Manual Trigger – This flow will display the current temperature and humidity readings using the Inject and Debug nodes.
The complete code for this project is shown below and is available in my GitHub repository.
[
    {
        "id": "098aa5ee3ff5101c",
        "type": "tab",
        "label": "DHT22 Custom Dashboard",
        "disabled": false,
        "info": "",
        "env": []
    },
    {
        "id": "fbc7583e00774a30",
        "type": "http in",
        "z": "098aa5ee3ff5101c",
        "name": "",
        "url": "/dht22-dashboard",
        "method": "get",
        "upload": false,
        "swaggerDoc": "",
        "x": 380,
        "y": 240,
        "wires": [
            [
                "a5ebc553da1af8c2"
            ]
        ]
    },
    {
        "id": "c314763f331f3aab",
        "type": "template",
        "z": "098aa5ee3ff5101c",
        "name": "HTML",
        "field": "payload",
        "fieldType": "msg",
        "format": "handlebars",
        "syntax": "mustache",
        "template": "<!DOCTYPE html>\n<html lang=\"en\">\n  <head>\n    <meta charset=\"UTF-8\" />\n    <meta http-equiv=\"X-UA-Compatible\" content=\"IE=edge\" />\n    <meta name=\"viewport\" content=\"width=device-width, initial-scale=1.0\" />\n    <title>DHT22 - Node Red - Dashboard</title>\n    <link\n      href=\"https://fonts.googleapis.com/icon?family=Material+Symbols+Sharp\"\n      rel=\"stylesheet\"\n    />\n    <script src=\"https://cdn.plot.ly/plotly-2.16.1.min.js\"></script>\n    <style>{{{payload.style}}}</style>\n  </head>\n  <body>\n    <div class=\"container\">\n      <aside>\n        <div class=\"top\">\n          <div class=\"logo\">\n            <img src=\"images/logo.png\" alt=\"\" />\n            <h2>DONSKYTECH</h2>\n          </div>\n          <div class=\"close\" id=\"close-btn\">\n            <span class=\"material-symbols-sharp\"> close </span>\n          </div>\n        </div>\n        <div class=\"sidebar\">\n          <a href=\"#\" class=\"active\">\n            <span class=\"material-symbols-sharp\"> dashboard </span>\n            <h3>Dashboard</h3>\n          </a>\n        </div>\n      </aside>\n      <main>\n        <h1>Node-Red - DHT22 - Dashboard</h1>\n        <div class=\"insights\">\n          <div class=\"temperature\">\n            <div class=\"middle\">\n              <div class=\"left\">\n                <h3>Temperature</h3>\n                <h1 id=\"temperature\">0 C</h1>\n              </div>\n              <div class=\"icon\">\n                <span class=\"material-symbols-sharp\"> device_thermostat </span>\n              </div>\n            </div>\n          </div>\n          <!-- End of temperature -->\n          <div class=\"humidity\">\n            <div class=\"middle\">\n              <div class=\"left\">\n                <h3>Humidity</h3>\n                <h1 id=\"humidity\">0 %</h1>\n              </div>\n              <div class=\"icon\">\n                <span class=\"material-symbols-sharp\">\n                  humidity_percentage\n                </span>\n              </div>\n            </div>\n          </div>\n          <!-- End of humidity -->\n        </div>\n        <!-- End of Insights -->\n        <div class=\"histories\">\n          <h2>Historical Charts</h2>\n          <div class=\"history-charts\">\n            <div id=\"temperature-history\" class=\"history-divs\"></div>\n            <div id=\"humidity-history\" class=\"history-divs\"></div>\n          </div>\n        </div>\n      </main>\n      <div class=\"right\">\n        <div class=\"top\">\n          <button id=\"menu-btn\">\n            <span class=\"material-symbols-sharp\"> menu </span>\n          </button>\n          <div class=\"theme-toggler\">\n            <span class=\"material-symbols-sharp active\"> light_mode </span>\n            <span class=\"material-symbols-sharp\"> dark_mode </span>\n          </div>\n        </div>\n        <!-- End of top -->\n        <div class=\"gauge-charts\">\n          <h2>Gauge Charts</h2>\n          <div class=\"item\">\n            <div id=\"temperature-gauge\"></div>\n          </div>\n          <div class=\"item\">\n            <div id=\"humidity-gauge\"></div>\n          </div>\n        </div>\n      </div>\n    </div>\n    <script>{{{payload.script}}}</script>\n  </body>\n</html>\n",
        "output": "str",
        "x": 930,
        "y": 380,
        "wires": [
            [
                "045c78d5c132aa86"
            ]
        ]
    },
    {
        "id": "045c78d5c132aa86",
        "type": "http response",
        "z": "098aa5ee3ff5101c",
        "name": "",
        "statusCode": "",
        "headers": {},
        "x": 1070,
        "y": 240,
        "wires": []
    },
    {
        "id": "a5ebc553da1af8c2",
        "type": "template",
        "z": "098aa5ee3ff5101c",
        "name": "Javascript",
        "field": "payload.script",
        "fieldType": "msg",
        "format": "handlebars",
        "syntax": "mustache",
        "template": "// Target specific HTML items\nconst sideMenu = document.querySelector(\"aside\");\nconst menuBtn = document.querySelector(\"#menu-btn\");\nconst closeBtn = document.querySelector(\"#close-btn\");\nconst themeToggler = document.querySelector(\".theme-toggler\");\n\n// Holds the background color of all chart\nvar chartBGColor = getComputedStyle(document.body).getPropertyValue(\n  \"--chart-background\"\n);\nvar chartFontColor = getComputedStyle(document.body).getPropertyValue(\n  \"--chart-font-color\"\n);\nvar chartAxisColor = getComputedStyle(document.body).getPropertyValue(\n  \"--chart-axis-color\"\n);\n\n/*\n  Event listeners for any HTML click\n*/\nmenuBtn.addEventListener(\"click\", () => {\n  sideMenu.style.display = \"block\";\n});\n\ncloseBtn.addEventListener(\"click\", () => {\n  sideMenu.style.display = \"none\";\n});\n\nthemeToggler.addEventListener(\"click\", () => {\n  document.body.classList.toggle(\"dark-theme-variables\");\n  themeToggler.querySelector(\"span:nth-child(1)\").classList.toggle(\"active\");\n  themeToggler.querySelector(\"span:nth-child(2)\").classList.toggle(\"active\");\n\n  // Update Chart background\n  chartBGColor = getComputedStyle(document.body).getPropertyValue(\n    \"--chart-background\"\n  );\n  chartFontColor = getComputedStyle(document.body).getPropertyValue(\n    \"--chart-font-color\"\n  );\n  chartAxisColor = getComputedStyle(document.body).getPropertyValue(\n    \"--chart-axis-color\"\n  );\n  updateChartsBackground();\n});\n\n/*\n  Plotly.js graph and chart setup code\n*/\nvar temperatureHistoryDiv = document.getElementById(\"temperature-history\");\nvar humidityHistoryDiv = document.getElementById(\"humidity-history\");\n\nvar temperatureGaugeDiv = document.getElementById(\"temperature-gauge\");\nvar humidityGaugeDiv = document.getElementById(\"humidity-gauge\");\n\nconst historyCharts = [temperatureHistoryDiv, humidityHistoryDiv];\n\nconst gaugeCharts = [temperatureGaugeDiv, humidityGaugeDiv];\n\n// History Data\nvar temperatureTrace = {\n  x: [],\n  y: [],\n  name: \"Temperature\",\n  mode: \"lines+markers\",\n  type: \"line\",\n};\nvar humidityTrace = {\n  x: [],\n  y: [],\n  name: \"Humidity\",\n  mode: \"lines+markers\",\n  type: \"line\",\n};\n\nvar temperatureLayout = {\n  autosize: true,\n  title: {\n    text: \"Temperature\",\n  },\n  font: {\n    size: 12,\n    color: chartFontColor,\n    family: \"poppins, san-serif\",\n  },\n  colorway: [\"#05AD86\"],\n  margin: { t: 40, b: 40, l: 60, r: 60, pad: 10 },\n  plot_bgcolor: chartBGColor,\n  paper_bgcolor: chartBGColor,\n  xaxis: {\n    color: chartAxisColor,\n    linecolor: chartAxisColor,\n    gridwidth: \"2\",\n    autorange: true,\n  },\n  yaxis: {\n    color: chartAxisColor,\n    linecolor: chartAxisColor,\n    gridwidth: \"2\",\n    autorange: true,\n  },\n};\nvar humidityLayout = {\n  autosize: true,\n  title: {\n    text: \"Humidity\",\n  },\n  font: {\n    size: 12,\n    color: chartFontColor,\n    family: \"poppins, san-serif\",\n  },\n  colorway: [\"#05AD86\"],\n  margin: { t: 40, b: 40, l: 30, r: 30, pad: 0 },\n  plot_bgcolor: chartBGColor,\n  paper_bgcolor: chartBGColor,\n  xaxis: {\n    color: chartAxisColor,\n    linecolor: chartAxisColor,\n    gridwidth: \"2\",\n  },\n  yaxis: {\n    color: chartAxisColor,\n    linecolor: chartAxisColor,\n  },\n};\n\nvar config = { responsive: true };\n\nwindow.addEventListener(\"load\", (event) => {\n  Plotly.newPlot(\n    temperatureHistoryDiv,\n    [temperatureTrace],\n    temperatureLayout,\n    config\n  );\n  Plotly.newPlot(humidityHistoryDiv, [humidityTrace], humidityLayout, config);\n\n  // Run it initially\n  handleDeviceChange(mediaQuery);\n});\n\n// Gauge Data\nvar temperatureData = [\n  {\n    domain: { x: [0, 1], y: [0, 1] },\n    value: 0,\n    title: { text: \"Temperature\" },\n    type: \"indicator\",\n    mode: \"gauge+number+delta\",\n    delta: { reference: 30 },\n    gauge: {\n      axis: { range: [null, 50] },\n      steps: [\n        { range: [0, 20], color: \"lightgray\" },\n        { range: [20, 30], color: \"gray\" },\n      ],\n      threshold: {\n        line: { color: \"red\", width: 4 },\n        thickness: 0.75,\n        value: 30,\n      },\n    },\n  },\n];\n\nvar humidityData = [\n  {\n    domain: { x: [0, 1], y: [0, 1] },\n    value: 0,\n    title: { text: \"Humidity\" },\n    type: \"indicator\",\n    mode: \"gauge+number+delta\",\n    delta: { reference: 50 },\n    gauge: {\n      axis: { range: [null, 100] },\n      steps: [\n        { range: [0, 20], color: \"lightgray\" },\n        { range: [20, 30], color: \"gray\" },\n      ],\n      threshold: {\n        line: { color: \"red\", width: 4 },\n        thickness: 0.75,\n        value: 30,\n      },\n    },\n  },\n];\n\nvar layout = { width: 300, height: 250, margin: { t: 0, b: 0, l: 0, r: 0 } };\n\nPlotly.newPlot(temperatureGaugeDiv, temperatureData, layout);\nPlotly.newPlot(humidityGaugeDiv, humidityData, layout);\n\n// Will hold the arrays we receive from our DHT22 sensor\n// Temperature\nlet newTempXArray = [];\nlet newTempYArray = [];\n// Humidity\nlet newHumidityXArray = [];\nlet newHumidityYArray = [];\n\n// The maximum number of data points displayed on our scatter/line graph\nlet MAX_GRAPH_POINTS = 12;\nlet ctr = 0;\n\n// Callback function that will retrieve our latest sensor readings and redraw our Gauge with the latest readings\nfunction updateSensorReadings(jsonResponse) {\n  console.log(typeof jsonResponse);\n  console.log(jsonResponse);\n\n  let temperature = Number(jsonResponse.temperature).toFixed(2);\n  let humidity = Number(jsonResponse.humidity).toFixed(2);\n\n  updateBoxes(temperature, humidity);\n\n  updateGauge(temperature, humidity);\n\n  // Update Temperature Line Chart\n  updateCharts(\n    temperatureHistoryDiv,\n    newTempXArray,\n    newTempYArray,\n    temperature\n  );\n  // Update Humidity Line Chart\n  updateCharts(\n    humidityHistoryDiv,\n    newHumidityXArray,\n    newHumidityYArray,\n    humidity\n  );\n}\n\nfunction updateBoxes(temperature, humidity) {\n  let temperatureDiv = document.getElementById(\"temperature\");\n  let humidityDiv = document.getElementById(\"humidity\");\n\n  temperatureDiv.innerHTML = temperature + \" C\";\n  humidityDiv.innerHTML = humidity + \" %\";\n}\n\nfunction updateGauge(temperature, humidity) {\n  var temperature_update = {\n    value: temperature,\n  };\n  var humidity_update = {\n    value: humidity,\n  };\n\n  Plotly.update(temperatureGaugeDiv, temperature_update);\n  Plotly.update(humidityGaugeDiv, humidity_update);\n}\n\nfunction updateCharts(lineChartDiv, xArray, yArray, sensorRead) {\n  if (xArray.length >= MAX_GRAPH_POINTS) {\n    xArray.shift();\n  }\n  if (yArray.length >= MAX_GRAPH_POINTS) {\n    yArray.shift();\n  }\n  xArray.push(ctr++);\n  yArray.push(sensorRead);\n\n  var data_update = {\n    x: [xArray],\n    y: [yArray],\n  };\n\n  Plotly.update(lineChartDiv, data_update);\n}\n\nfunction updateChartsBackground() {\n  // updates the background color of historical charts\n  var updateHistory = {\n    plot_bgcolor: chartBGColor,\n    paper_bgcolor: chartBGColor,\n    font: {\n      color: chartFontColor,\n    },\n    xaxis: {\n      color: chartAxisColor,\n      linecolor: chartAxisColor,\n    },\n    yaxis: {\n      color: chartAxisColor,\n      linecolor: chartAxisColor,\n    },\n  };\n  historyCharts.forEach((chart) => Plotly.relayout(chart, updateHistory));\n\n  // updates the background color of gauge charts\n  var gaugeHistory = {\n    plot_bgcolor: chartBGColor,\n    paper_bgcolor: chartBGColor,\n    font: {\n      color: chartFontColor,\n    },\n    xaxis: {\n      color: chartAxisColor,\n      linecolor: chartAxisColor,\n    },\n    yaxis: {\n      color: chartAxisColor,\n      linecolor: chartAxisColor,\n    },\n  };\n  gaugeCharts.forEach((chart) => Plotly.relayout(chart, gaugeHistory));\n}\n\nconst mediaQuery = window.matchMedia(\"(max-width: 600px)\");\n\nmediaQuery.addEventListener(\"change\", function (e) {\n  handleDeviceChange(e);\n});\n\nfunction handleDeviceChange(e) {\n  if (e.matches) {\n    console.log(\"Inside Mobile\");\n    var updateHistory = {\n      width: 323,\n      height: 250,\n      \"xaxis.autorange\": true,\n      \"yaxis.autorange\": true,\n    };\n    historyCharts.forEach((chart) => Plotly.relayout(chart, updateHistory));\n  } else {\n    var updateHistory = {\n      width: 550,\n      height: 260,\n      \"xaxis.autorange\": true,\n      \"yaxis.autorange\": true,\n    };\n    historyCharts.forEach((chart) => Plotly.relayout(chart, updateHistory));\n  }\n}\n\nfunction retrieveSensorReadings() {\n  fetch(`/sensorReadings`)\n    .then((response) => response.json())\n    .then((jsonResponse) => {\n      updateSensorReadings(jsonResponse);\n    });\n}\n\n// Continuos loop that runs evry 3 seconds to update our web page with the latest sensor readings\n(function loop() {\n  setTimeout(() => {\n    retrieveSensorReadings();\n    loop();\n  }, 3000);\n})();\n",
        "output": "str",
        "x": 600,
        "y": 380,
        "wires": [
            [
                "485bb7dcb66de76f"
            ]
        ]
    },
    {
        "id": "b5136629e78f3932",
        "type": "http in",
        "z": "098aa5ee3ff5101c",
        "name": "",
        "url": "/sensorReadings",
        "method": "get",
        "upload": false,
        "swaggerDoc": "",
        "x": 420,
        "y": 580,
        "wires": [
            [
                "94dfa9d81e3397dd"
            ]
        ]
    },
    {
        "id": "26a53cd14d224d8d",
        "type": "function",
        "z": "098aa5ee3ff5101c",
        "name": "Get Temperature Readings",
        "func": "msg.payload = { temperature: msg.payload, humidity: msg.humidity};\nreturn msg;",
        "outputs": 1,
        "noerr": 0,
        "initialize": "",
        "finalize": "",
        "libs": [],
        "x": 840,
        "y": 580,
        "wires": [
            [
                "f46a7d5c48f657d9"
            ]
        ]
    },
    {
        "id": "6692713377943b0b",
        "type": "http response",
        "z": "098aa5ee3ff5101c",
        "name": "",
        "statusCode": "200",
        "headers": {},
        "x": 1240,
        "y": 580,
        "wires": []
    },
    {
        "id": "f46a7d5c48f657d9",
        "type": "change",
        "z": "098aa5ee3ff5101c",
        "name": "Set Headers",
        "rules": [
            {
                "t": "set",
                "p": "headers",
                "pt": "msg",
                "to": "{}",
                "tot": "json"
            },
            {
                "t": "set",
                "p": "headers.content-type",
                "pt": "msg",
                "to": "application/json",
                "tot": "str"
            }
        ],
        "action": "",
        "property": "",
        "from": "",
        "to": "",
        "reg": false,
        "x": 1050,
        "y": 480,
        "wires": [
            [
                "6692713377943b0b"
            ]
        ]
    },
    {
        "id": "485bb7dcb66de76f",
        "type": "template",
        "z": "098aa5ee3ff5101c",
        "name": "CSS",
        "field": "payload.style",
        "fieldType": "msg",
        "format": "handlebars",
        "syntax": "mustache",
        "template": "@import url(\"https://fonts.googleapis.com/css2?family=Poppins:wght@300;400;500;600;700;800&display=swap\");\n\n:root {\n  --color-primary: #7380ec;\n  --color-danger: #ff7782;\n  --color-success: #41f1b6;\n  --color-warning: #ffbb55;\n  --color-white: #fff;\n  --color-info-dark: #7d8da1;\n  --color-info-light: #dce1eb;\n  --color-dark: #363949;\n  --color-light: rgba(132, 139, 200, 0.18);\n  --color-primary-variant: #111e88;\n  --color-dark-variant: #677483;\n  --color-background: #f6f6f9;\n\n  --color-insight-1: rgb(99, 209, 35);\n  --color-insight-2: rgb(233, 245, 59);\n  --color-insight-3: rgb(204, 52, 67);\n  --color-insight-4: rgb(56, 183, 238);\n\n  --card-border-radius: 2rem;\n  --border-radius-1: 0.4rem;\n  --border-radius-2: 0.8rem;\n  --border-radius-3: 1.2rem;\n\n  --card-padding: 1.8rem;\n  --padding-1: 1.2rem;\n\n  --box-shadow: 0 2rem 3rem var(--color-light);\n\n  /* Plotly Chart Color */\n  --chart-background: #fff;\n  --chart-font-color: #444;\n  --chart-axis-color: #444;\n}\n/* Dark Theme Variables */\n.dark-theme-variables {\n  --color-background: #090d3e;\n  --color-white: #0b0f4a;\n  --color-primary: #fff;\n  --color-dark: #edeffd;\n  --color-dark-variant: #fff;\n  --color-light: rgba(0, 0, 0, 0.4);\n  --box-shadow: 0 2rem 3rem var(--color-light);\n\n  --chart-background: #0d1256;\n  --chart-font-color: #fff;\n  --chart-axis-color: #fff;\n}\n\n* {\n  margin: 0;\n  padding: 0;\n  outline: 0;\n  appearance: none;\n  text-decoration: none;\n  list-style: none;\n  box-sizing: border-box;\n}\n\nhtml {\n  font-size: 14px;\n}\nbody {\n  width: 100vw;\n  height: 100vh;\n  font-family: poppins, san-serif;\n  font-size: 0.88rem;\n  background: var(--color-background);\n  user-select: none;\n  overflow-x: hidden;\n  color: var(--color-dark-variant);\n}\n.container {\n  display: grid;\n  width: 96%;\n  margin: 0 auto;\n  gap: 1.8rem;\n  grid-template-columns: 14rem auto 30rem;\n}\na {\n  color: var(--color-dark);\n}\nimg {\n  display: block;\n  width: 100%;\n}\nh1 {\n  font-weight: 800;\n  font-size: 1.8rem;\n}\nh2 {\n  font-size: 1.4rem;\n}\nh3 {\n  font-size: 0.87rem;\n}\nh4 {\n  font-size: 0.8rem;\n}\nh5 {\n  font-size: 0.77rem;\n}\nsmall {\n  font-size: 0.75rem;\n}\n.profile-photo {\n  width: 2.8rem;\n  height: 2.8rem;\n  border-radius: 50%;\n  overflow: hidden;\n}\n.text-muted {\n  color: var(--color-info-light);\n}\np {\n  color: var(--color-dark-variant);\n}\nb {\n  color: var(--color-dark-variant);\n}\n.primary {\n  color: var(--color-primary);\n}\n.danger {\n  color: var(--color-danger);\n}\n.success {\n  color: var(--color-success);\n}\n.warning {\n  color: var(--color-warning);\n}\n\n/***** Sidebar Image*****/\naside {\n  height: 100vh;\n}\naside .top {\n  display: flex;\n  align-items: center;\n  justify-content: space-between;\n  margin-top: 1.4rem;\n}\naside .logo {\n  display: flex;\n  gap: 0.8rem;\n}\naside .logo img {\n  width: 2rem;\n  height: 2re;\n}\naside .close {\n  display: none;\n}\n/***** Sidebar Links*****/\naside .sidebar {\n  display: flex;\n  flex-direction: column;\n  height: 86vh;\n  position: relative;\n  top: 3rem;\n}\naside h3 {\n  font-weight: 500;\n}\n\naside .sidebar a {\n  display: flex;\n  color: var(--color-info-dark);\n  margin-left: 2rem;\n  gap: 1rem;\n  align-items: center;\n  position: relative;\n  height: 3.7rem;\n  transition: all 300ms ease;\n}\n\naside .sidebar a span {\n  font-size: 1.6rem;\n  transition: all 300ms ease;\n}\n\n/* aside .sidebar a:last-child {\n  position: absolute;\n  bottom: 2rem;\n  width: 100%;\n} */\n\naside .sidebar a.active {\n  background: var(--color-light);\n  color: var(--color-primary);\n  margin-left: 0;\n}\naside .sidebar a.active:before {\n  content: \"\";\n  width: 6px;\n  height: 100%;\n  background: var(--color-primary);\n}\naside .sidebar a.active span {\n  color: var(--color-primary);\n  margin-left: calc(1rem - 6px);\n}\naside .sidebar a:hover {\n  color: var(--color-primary);\n}\n\naside .sidebar a:hover span {\n  margin-left: 1rem;\n}\n\n/************* main ******************/\nmain {\n  margin-top: 1.4rem;\n}\n\nmain .insights {\n  display: grid;\n  grid-template-columns: repeat(2, 1fr);\n  gap: 1.6rem;\n}\nmain .insights > div {\n  background: var(--color-white);\n  padding: var(--card-padding);\n  border-radius: var(--card-border-radius);\n  margin-top: 1rem;\n  box-shadow: var(--box-shadow);\n  transition: all 300ms ease;\n}\n\nmain .insights > div:hover {\n  box-shadow: none;\n}\n\nmain .insights > div span {\n  background: var(--color-primary);\n  padding: 0.5rem;\n  border-radius: 50%;\n  color: var(--color-white);\n  font-size: 2rem;\n}\n\nmain .insights > div.temperature span {\n  background: var(--color-insight-1);\n}\n\nmain .insights > div.humidity span {\n  background: var(--color-insight-2);\n}\n\nmain .insights > div.pressure span {\n  background: var(--color-insight-3);\n}\nmain .insights > div.altitude span {\n  background: var(--color-insight-4);\n}\n\nmain .insights > div .middle {\n  display: flex;\n  align-items: center;\n  justify-content: space-between;\n}\n\nmain .insights h3 {\n  margin: 1rem 0 0.6rem;\n  font-size: 1rem;\n}\n\n/************* End of Insights ******************/\nmain .histories {\n  margin-top: 2rem;\n}\n\nmain .history-charts {\n  display: grid;\n  grid-template-columns: repeat(2, 1fr);\n  gap: 2.5rem;\n  background: var(--color-white);\n  border-radius: var(--border-radius-1);\n  padding: var(--card-padding);\n  text-align: center;\n  box-shadow: var(--box-shadow);\n}\nmain .history-charts:hover {\n  box-shadow: none;\n}\n\nmain .history-charts .history-divs {\n  text-align: center;\n}\n\nmain .histories h2 {\n  margin-bottom: 0.8rem;\n}\n\n/* ********RIGHT ********** */\n.right {\n  margin-top: 1.4rem;\n}\n.right .top {\n  display: flex;\n  justify-content: end;\n  gap: 2rem;\n}\n.right .top button {\n  display: none;\n}\n\n.right .theme-toggler {\n  background: var(--color-light);\n  display: flex;\n  justify-content: space-between;\n  align-items: center;\n  height: 1.6rem;\n  width: 4.2rem;\n  cursor: pointer;\n  border-radius: var(--border-radius-1);\n}\n\n.right .theme-toggler span {\n  font-size: 1.2rem;\n  width: 50%;\n  height: 100%;\n  display: flex;\n  align-items: center;\n  justify-content: center;\n}\n\n.right .theme-toggler span.active {\n  background: var(--color-primary);\n  color: white;\n  border-radius: var(--border-radius-1);\n}\n\n/* GAUGE CHARTS */\n.right .gauge-charts {\n  margin-top: 2rem;\n}\n.right .gauge-charts .item {\n  background: var(--color-white);\n  display: flex;\n  align-items: center;\n  justify-content: center;\n  gap: 1rem;\n  margin-bottom: 0.7rem;\n  padding: 1.4rem var(--card-padding);\n  border-radius: var(--border-radius-3);\n  box-shadow: var(--box-shadow);\n  transition: all 300ms ease;\n}\n.right .gauge-charts .item:hover {\n  box-shadow: none;\n}\n\n.right .gauge-charts .item .right {\n  display: flex;\n  justify-content: space-between;\n  align-items: start;\n  margin: 0;\n  width: 100%;\n}\n\n.right .gauge-charts .item .icon {\n  padding: 0.6rem;\n  color: var(--color-white);\n  border-radius: 50%;\n  background: var(--color-primary);\n  display: flex;\n}\n\n.right .gauge-charts .item.offline .icon {\n  background: var(--color-danger);\n}\n\n/* MEDIA QUERIES */\n@media screen and (max-width: 1200px) {\n  .container {\n    width: 94%;\n    grid-template-columns: 7rem auto 23rem;\n  }\n  aside .logo h2 {\n    display: none;\n  }\n\n  aside .sidebar h3 {\n    display: none;\n  }\n  aside .sidebar a {\n    width: 5.6rem;\n  }\n  aside .sidebar a:last-child {\n    position: relative;\n    margin-top: 1.8rem;\n  }\n  main .insights {\n    grid-template-columns: 1fr;\n  }\n  main .histories {\n    width: 94%;\n    position: absolute;\n    left: 50%;\n    transform: translateX(-50%);\n    margin: 2rem 0 0 8.8rem;\n  }\n  main .histories .history-charts {\n    grid-template-columns: 1fr;\n    width: 54vw;\n  }\n}\n\n@media only screen and (max-width: 992px) {\n  .container {\n    width: 94%;\n    grid-template-columns: 12rem auto 23rem;\n  }\n  main .insights {\n    grid-template-columns: repeat(2, 1fr);\n    gap: 1.6rem;\n  }\n  main .histories .history-charts {\n    grid-template-columns: 1fr;\n    align-items: center;\n    justify-content: center;\n  }\n}\n\n@media screen and (max-width: 768px) {\n  .container {\n    width: 100%;\n    grid-template-columns: 1fr;\n    /* height: 100vh; */\n  }\n  aside {\n    position: fixed;\n    left: -100%;\n    background: var(--color-white);\n    width: 18rem;\n    z-index: 3;\n    box-shadow: 1rem 3rem 4rem var(--color-light);\n    height: 100vh;\n    padding-right: var(--card-padding);\n    display: none;\n    animation: showMenu 400ms ease forwards;\n  }\n  @keyframes showMenu {\n    to {\n      left: 0;\n    }\n  }\n  aside .logo {\n    margin-left: 1rem;\n  }\n  aside .logo h2 {\n    display: inline;\n  }\n  aside .sidebar h3 {\n    display: inline;\n  }\n  aside .sidebar a {\n    width: 100%;\n    height: 3.4rem;\n  }\n  /* aside .sidebar a:last-child {\n    position: absolute;\n    bottom: 5rem;\n  } */\n  aside .close {\n    display: inline-block;\n    cursor: pointer;\n  }\n  main {\n    margin: 8rem 2rem 2rem 2rem;\n    padding: 0 1rem;\n  }\n  main .histories {\n    position: relative;\n    margin: 3rem 0 0 0;\n    width: 100%;\n  }\n  main .histories .history-charts {\n    width: 100%;\n    justify-content: center;\n    align-items: center;\n    display: flex;\n    flex-direction: column;\n    justify-content: center;\n    align-items: center;\n  }\n  .right {\n    width: 90%;\n    margin: 0 auto 0rem auto;\n  }\n  .right .top {\n    position: fixed;\n    top: 0;\n    left: 0;\n    align-items: center;\n    padding: 0 0.8rem;\n    height: 4.6rem;\n    background: var(--color-white);\n    width: 100%;\n    margin: 0;\n    z-index: 2;\n    box-shadow: 0 1rem 1 rem var(--color-light);\n  }\n  .right .top .theme-toggler {\n    width: 4.4rem;\n    position: absolute;\n    right: 2rem;\n  }\n  .right .profile .info {\n    display: none;\n  }\n\n  .right .top button {\n    display: inline-block;\n    background: transparent;\n    cursor: pointer;\n    color: var(--color-dark);\n    position: absolute;\n    left: 1rem;\n  }\n  .right .top button span {\n    font-size: 2rem;\n  }\n}\n\n@media screen and (max-width: 600px) {\n  .container {\n    width: 100%;\n    grid-template-columns: 1fr;\n    margin: 1rem 0 1rem 0;\n  }\n  main {\n    margin: 5rem 1rem 1rem 1rem;\n    padding: 0 1rem;\n    width: 90vw;\n  }\n\n  main .insights {\n    gap: 0.4rem;\n  }\n  main .insights > div {\n    padding: 0.4rem;\n  }\n\n  main .history-charts {\n    display: grid;\n    grid-template-columns: 1fr;\n  }\n}\n",
        "output": "str",
        "x": 750,
        "y": 240,
        "wires": [
            [
                "c314763f331f3aab"
            ]
        ]
    },
    {
        "id": "1739fade323b0f46",
        "type": "rpi-dht22",
        "z": "098aa5ee3ff5101c",
        "name": "DHT22",
        "topic": "rpi-dht22",
        "dht": 22,
        "pintype": "0",
        "pin": 4,
        "x": 680,
        "y": 800,
        "wires": [
            [
                "8059c7171b64d953"
            ]
        ]
    },
    {
        "id": "8059c7171b64d953",
        "type": "debug",
        "z": "098aa5ee3ff5101c",
        "name": "debug 1",
        "active": true,
        "tosidebar": true,
        "console": false,
        "tostatus": false,
        "complete": "true",
        "targetType": "full",
        "statusVal": "",
        "statusType": "auto",
        "x": 900,
        "y": 800,
        "wires": []
    },
    {
        "id": "838964f36923c827",
        "type": "inject",
        "z": "098aa5ee3ff5101c",
        "name": "",
        "props": [
            {
                "p": "payload"
            },
            {
                "p": "topic",
                "vt": "str"
            }
        ],
        "repeat": "",
        "crontab": "",
        "once": false,
        "onceDelay": 0.1,
        "topic": "",
        "payload": "",
        "payloadType": "date",
        "x": 400,
        "y": 800,
        "wires": [
            [
                "1739fade323b0f46"
            ]
        ]
    },
    {
        "id": "94dfa9d81e3397dd",
        "type": "rpi-dht22",
        "z": "098aa5ee3ff5101c",
        "name": "",
        "topic": "DHT22",
        "dht": 22,
        "pintype": "0",
        "pin": 4,
        "x": 600,
        "y": 480,
        "wires": [
            [
                "26a53cd14d224d8d"
            ]
        ]
    },
    {
        "id": "4917ebb7a67b8cba",
        "type": "comment",
        "z": "098aa5ee3ff5101c",
        "name": "Web Page Flow",
        "info": "",
        "x": 540,
        "y": 200,
        "wires": []
    },
    {
        "id": "a39823b5b88a343f",
        "type": "comment",
        "z": "098aa5ee3ff5101c",
        "name": "Asynchronous Update - HTTP end point",
        "info": "",
        "x": 350,
        "y": 520,
        "wires": []
    },
    {
        "id": "0ffb8e91d747b7fb",
        "type": "comment",
        "z": "098aa5ee3ff5101c",
        "name": "DHT Manual trigger",
        "info": "",
        "x": 490,
        "y": 760,
        "wires": []
    }
]
Let us go through how I configured each node in our custom Node-Red DHT22/DHT11 dashboard flow.
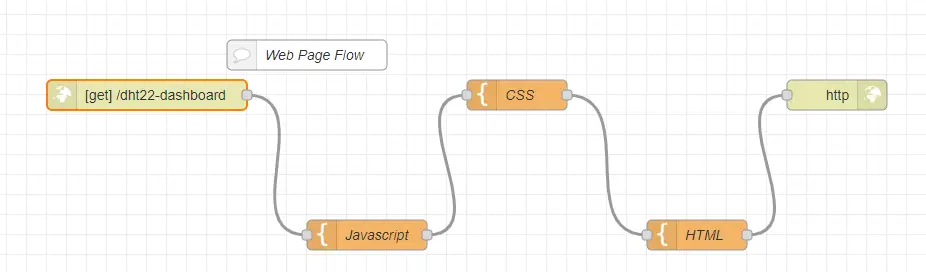
Web Page flow
Let us go thru the configurations that I did.
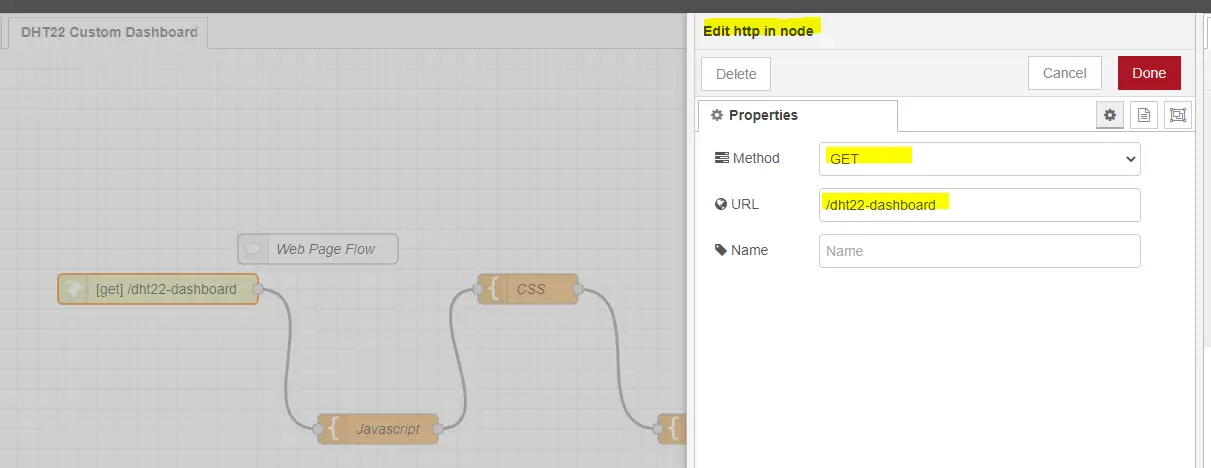
This is our network HTTP In node where I configured the root of our application as “/dht22-dashboard“
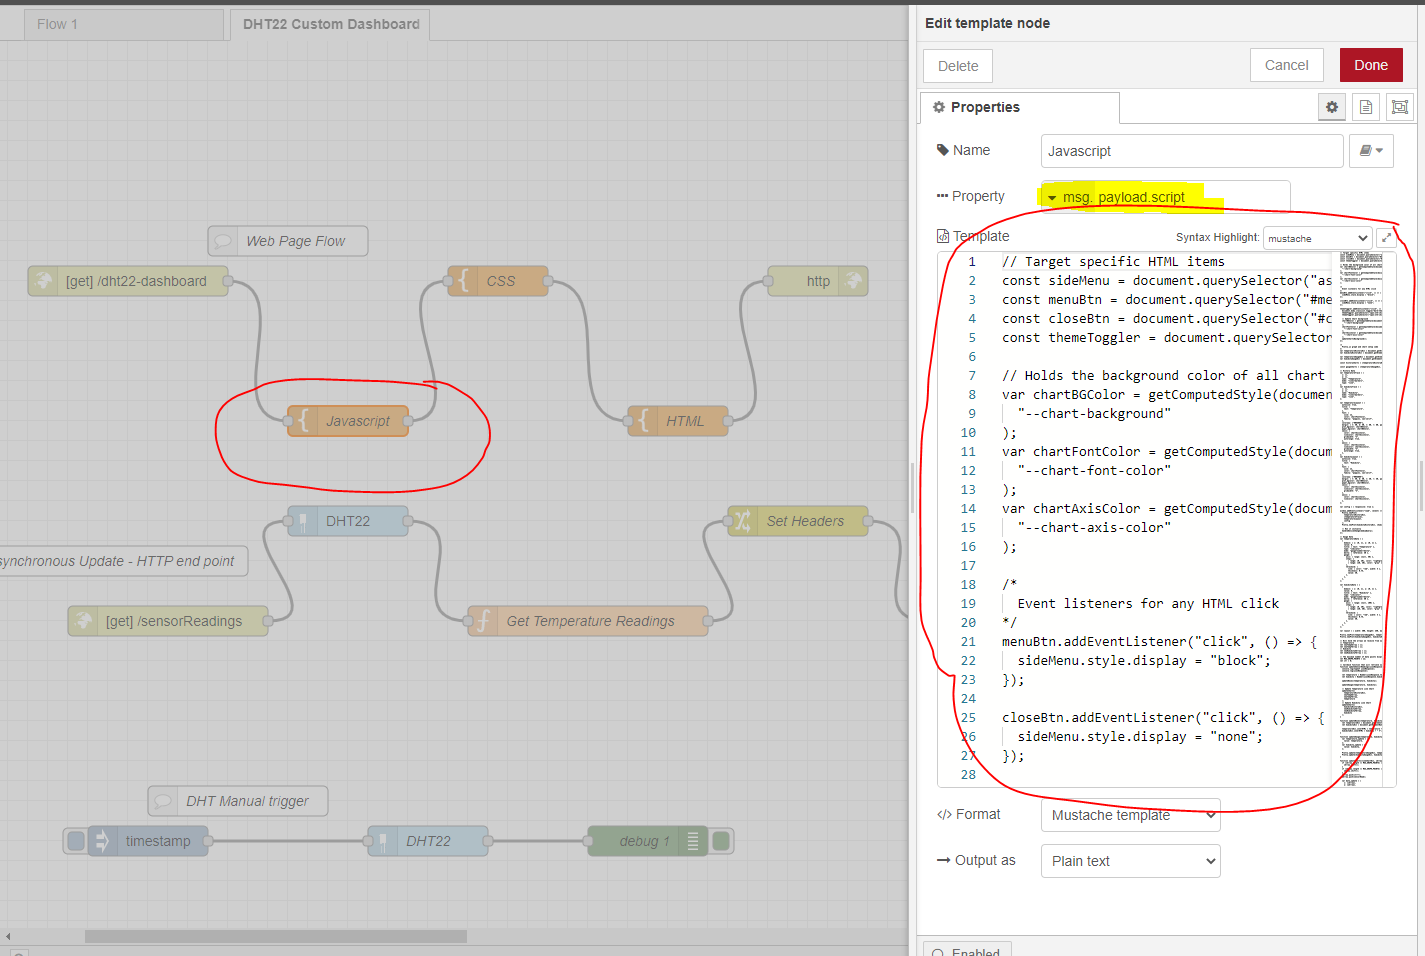
The Javascript template node is where we put our Javascript code and sets the property msg.payload.scripts
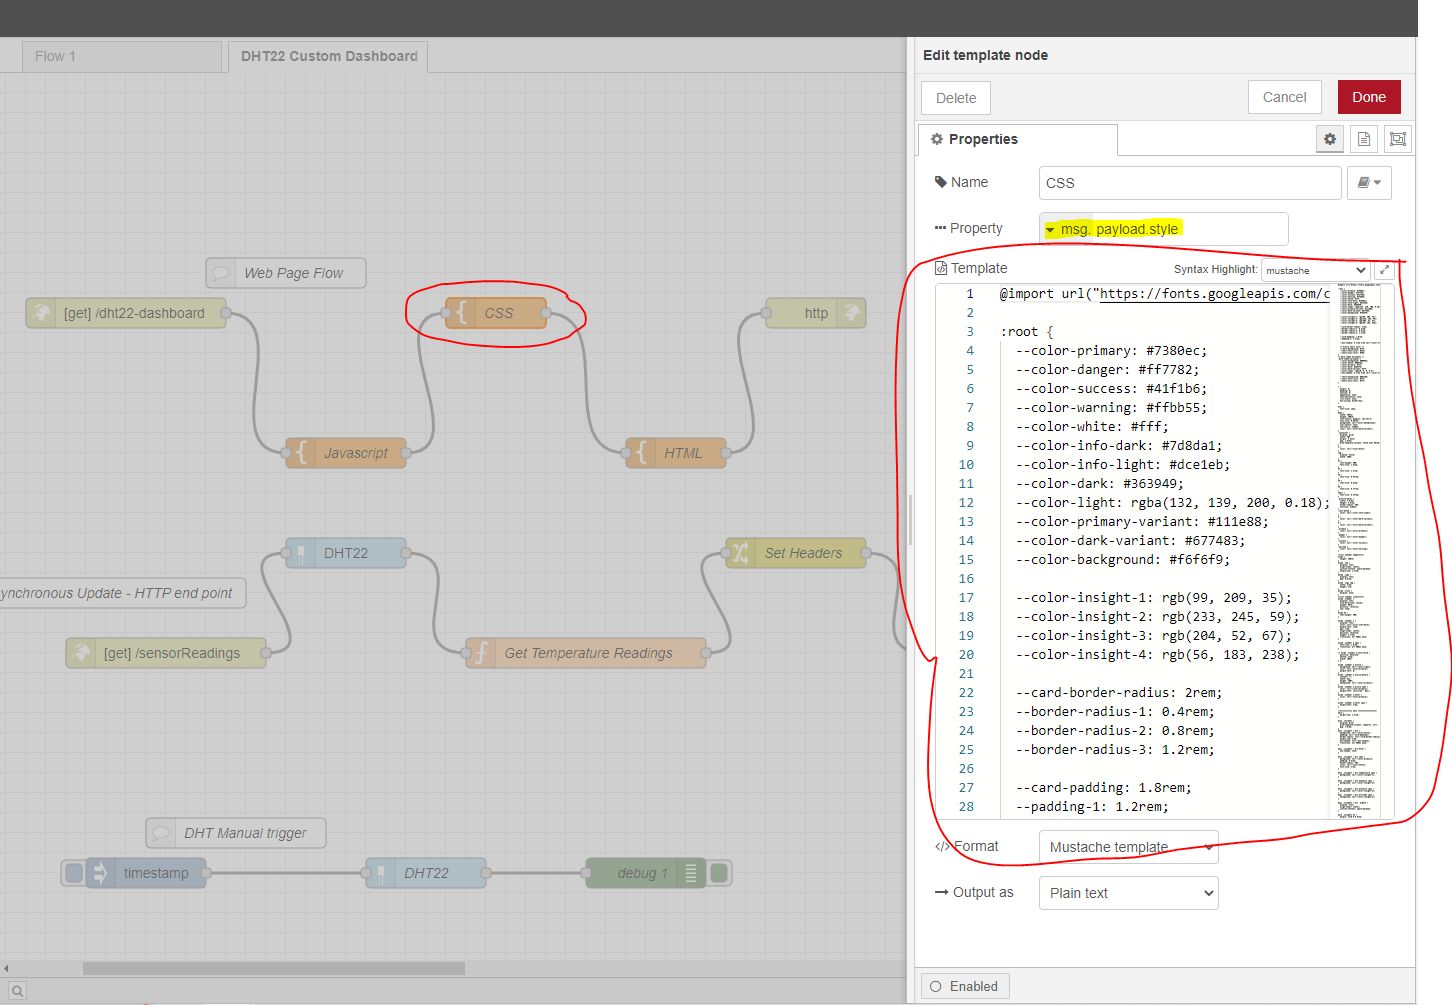
The CSS template node is where we defined our CSS styling for our web page.
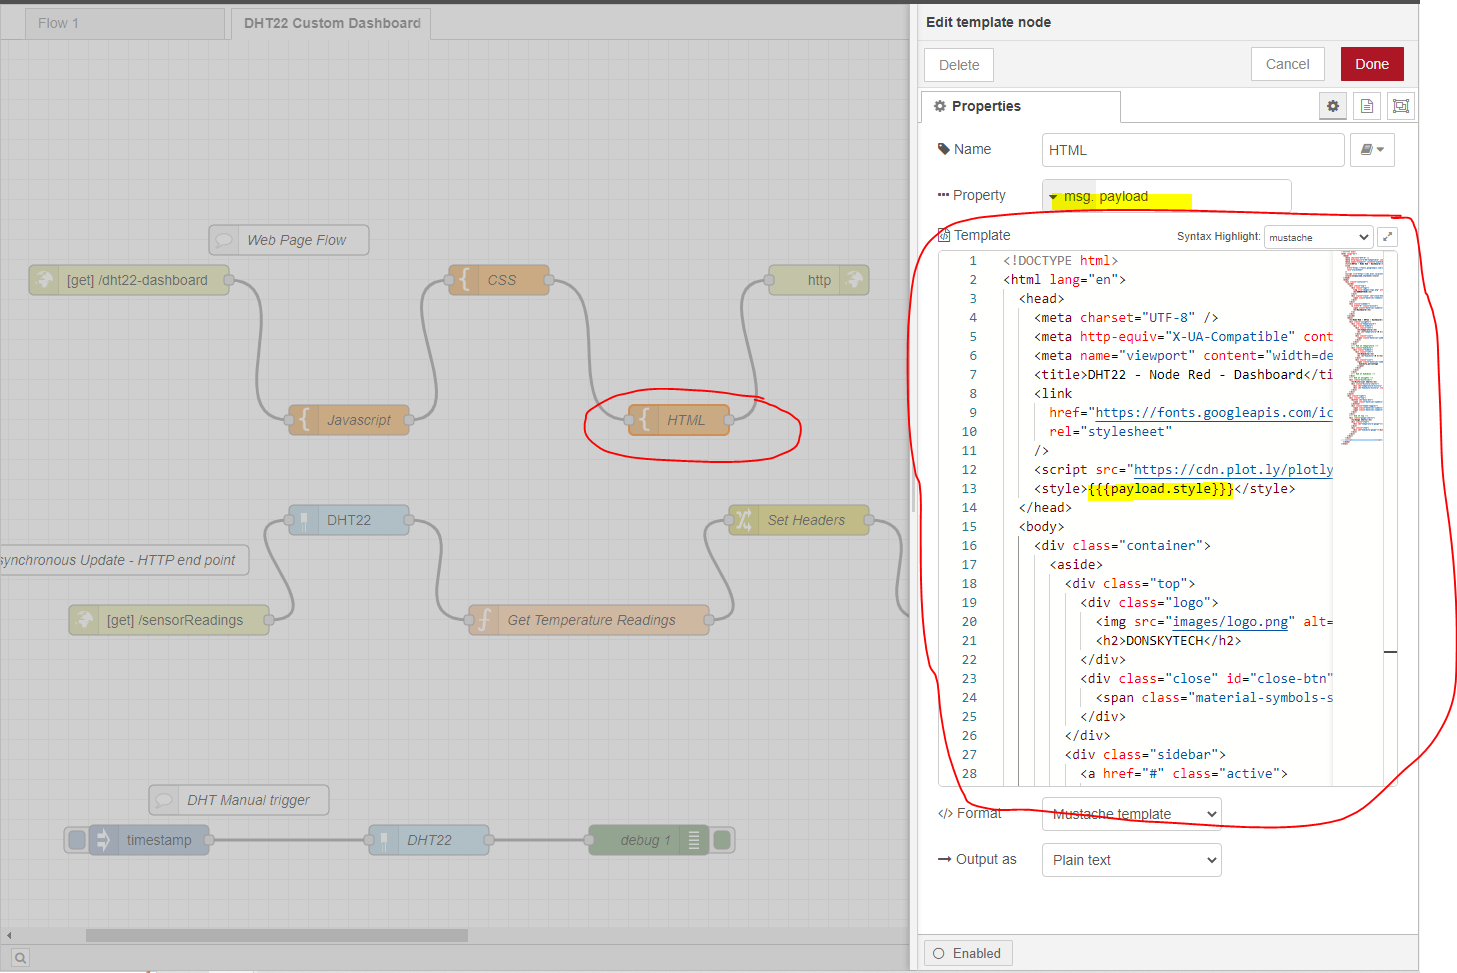
The HTML node is where we defined our HTML page and import the CSS and Javascript using the Mustache template.
The last node which is the HTTP response node terminates this flow and returns the content to the user which in this case is our index.html page.
What about the HTML/CSS/Javascript code?
The code for the HTML/CSS/Javascript is taken from one of the projects I have worked on about How to build your own custom MQTT dashboard. I am using MQTT there but you can remove the code that connects to the MQTT broker and replace the code with an HTTP Request. I have explained what each line of the code does.
This code is available also in my GitHub repository.
Asynchronous HTTP endpoint flow
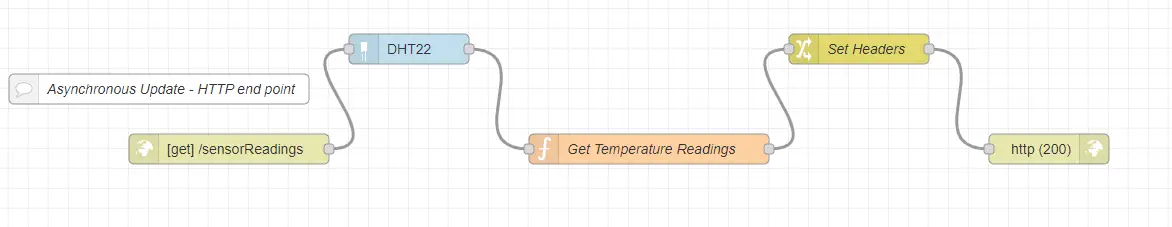
This is the flow that periodically responds to our request for sensor readings.
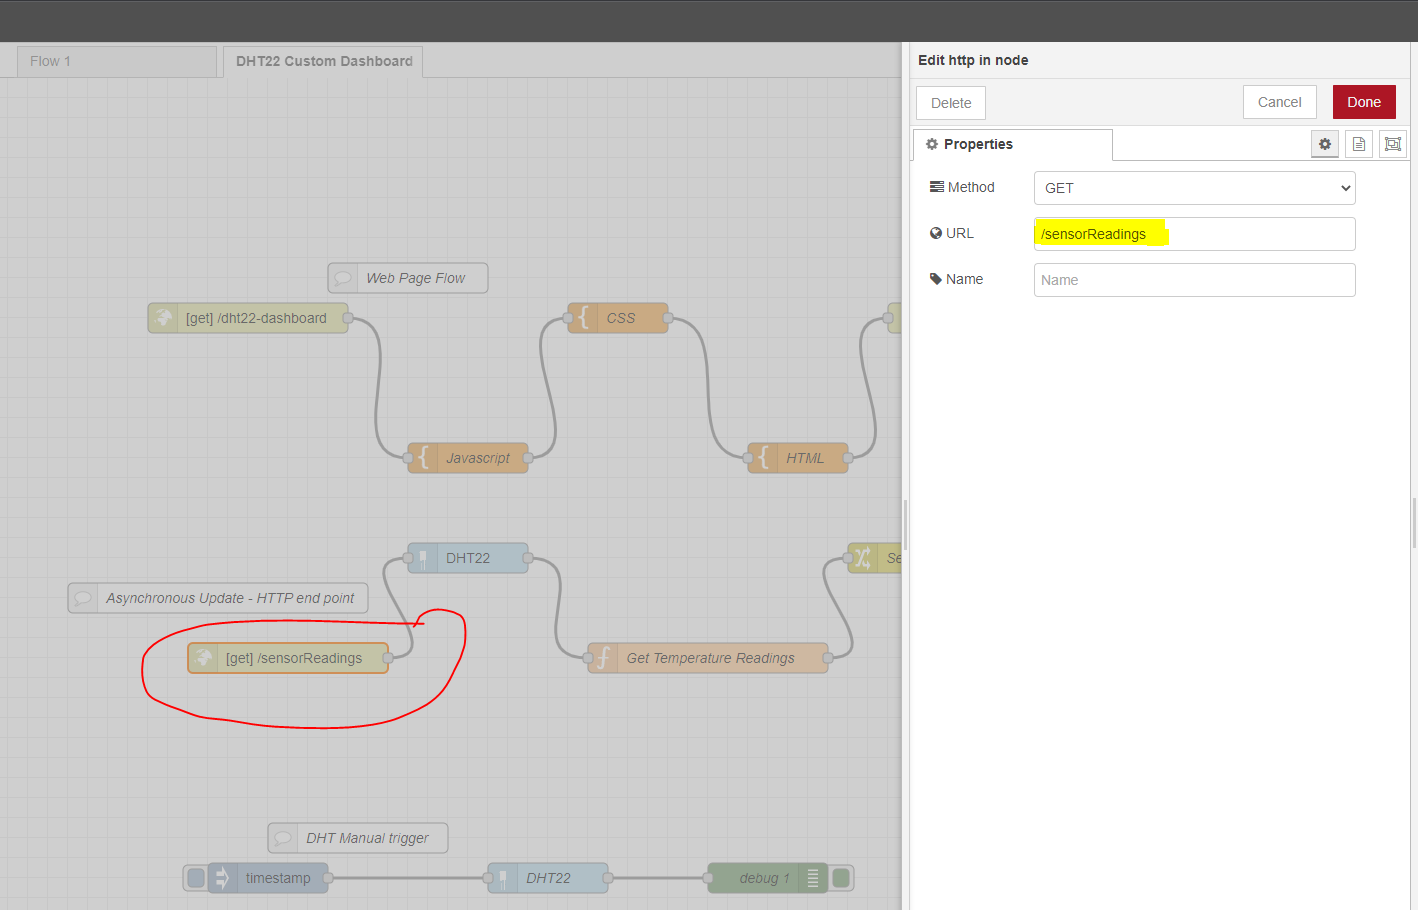
The URL maps to /sensorReadings with an HTTP GET method. This is mapped to the Javascript code below.
function retrieveSensorReadings() {
  fetch(`/sensorReadings`)
    .then((response) => response.json())
    .then((jsonResponse) => {
      updateSensorReadings(jsonResponse);
    });
}

// Continuos loop that runs evry 3 seconds to update our web page with the latest sensor readings
(function loop() {
  setTimeout(() => {
    retrieveSensorReadings();
    loop();
  }, 3000);
})();
Let us move on to the other part of this flow.
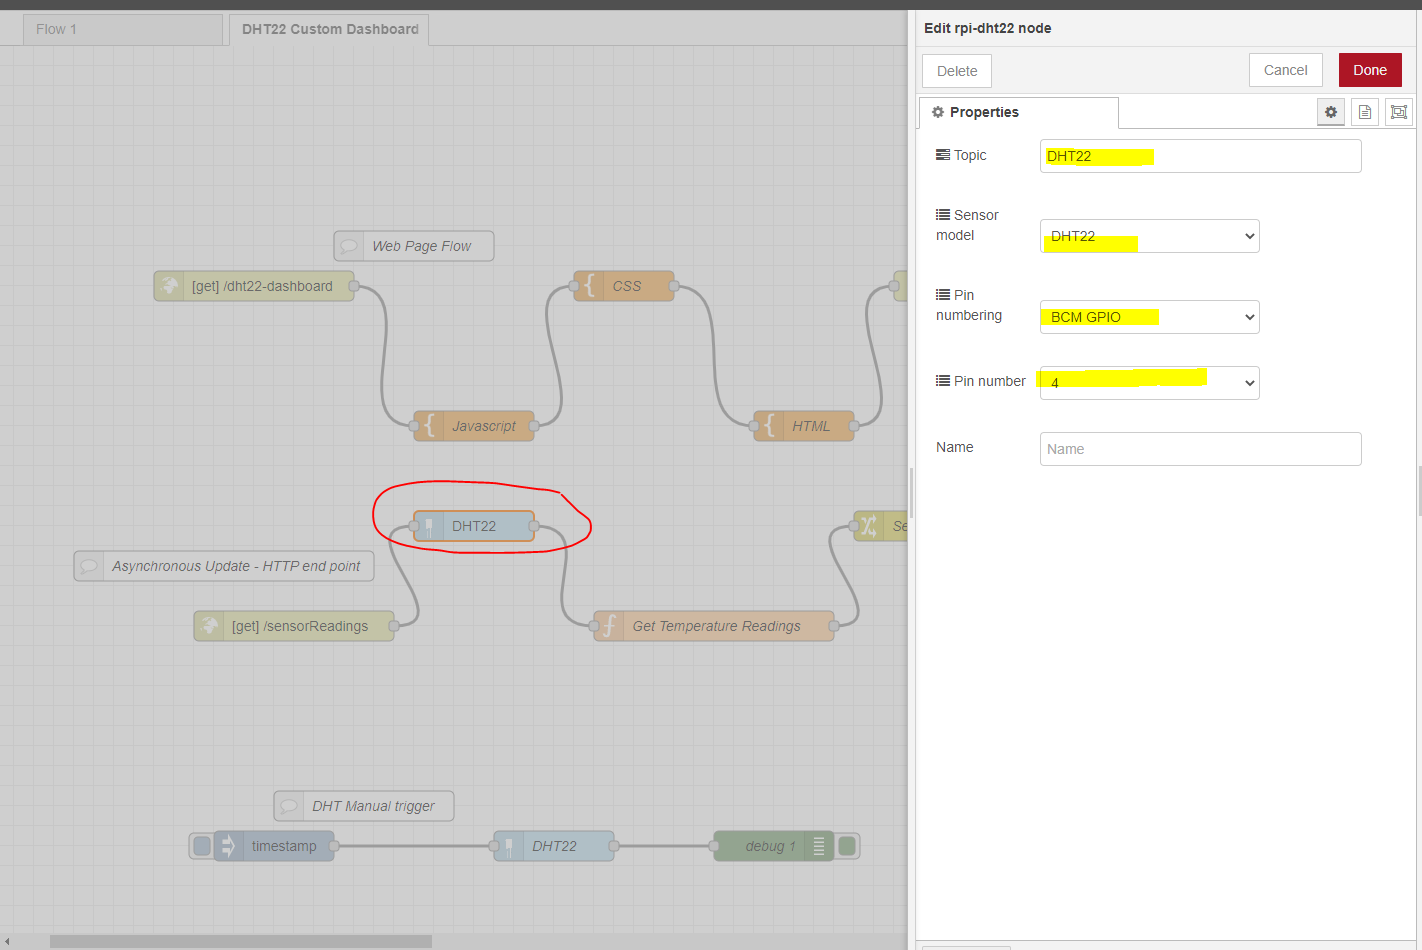
The DHT22 node is used to retrieve the sensor readings from our sensor. I have mapped it to the GPIO4 of my Raspberry Pi.
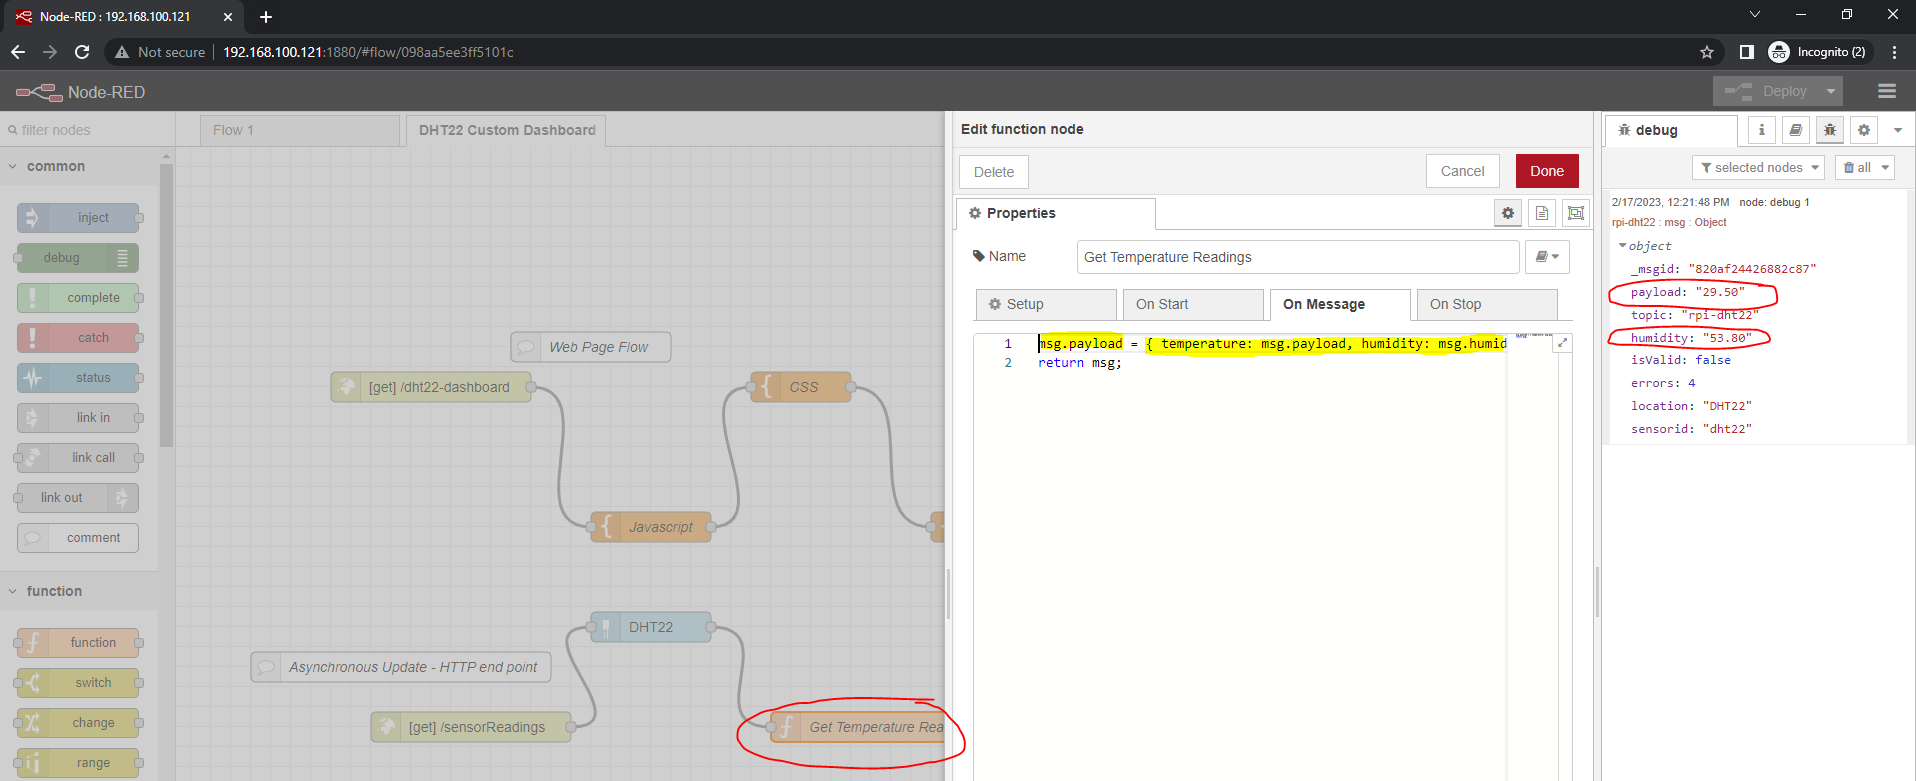
This is where we mapped our payload to a JSON object by reading the DHT22 message.
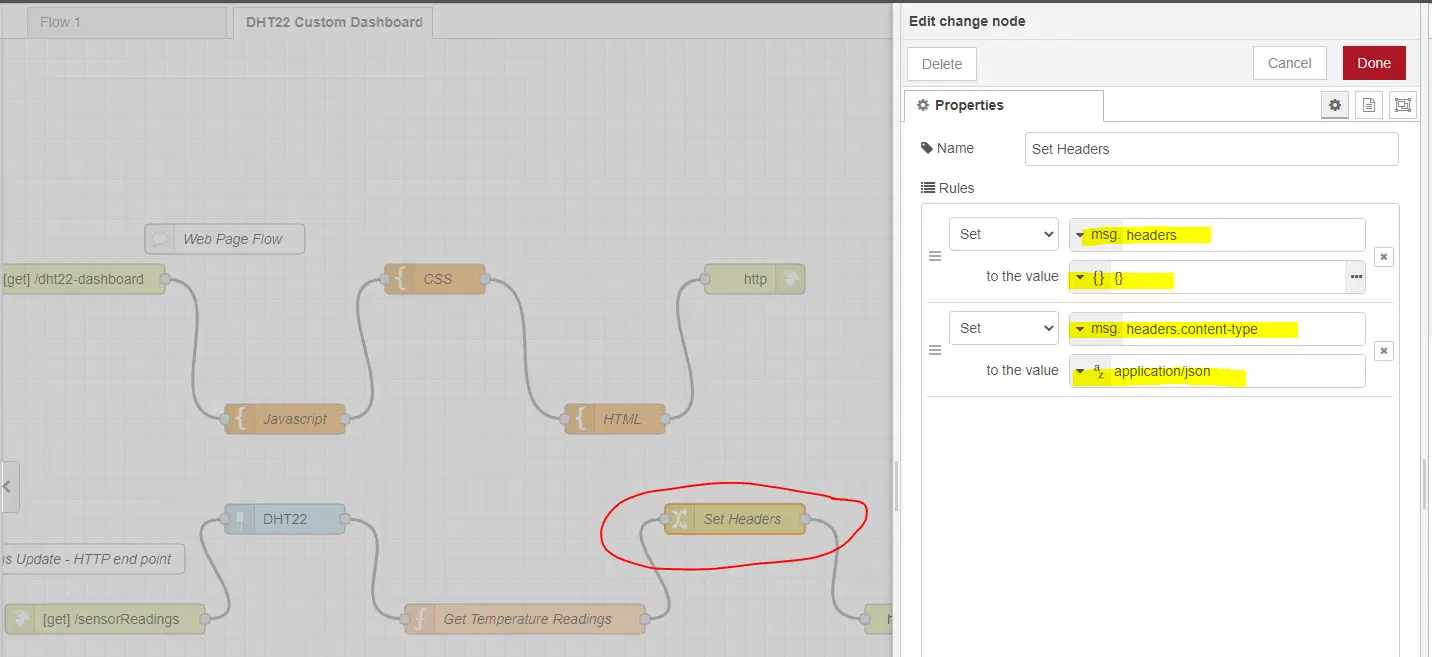
We set the HTTP response to application/JSON and terminate the flow with an HTTP response node.
DHT Manual Trigger
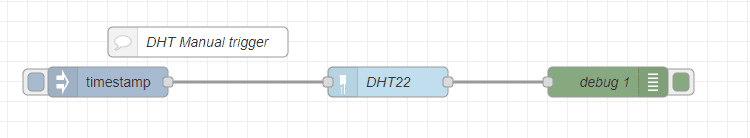
This is the manual flow of reading the DHT22/DHT11 sensor using the inject and debug node.
How to run the project?
Make sure that the DHT22/DHT11 node is added by installing it in the Manage Palette menu. Create a new flow and import the custom DHT22/DHT11 dashboard flow outline above.
Access the application by using the below URL. Change the IP address to that of your Node-Red IP or DNS name.
http://192.168.100.121:1880/dht22-dashboardWrap Up
We have successfully created our own custom Node-Red dashboard solution in this post.
I hope you learned something! Happy Exploring!
Leave a Reply