Introduction
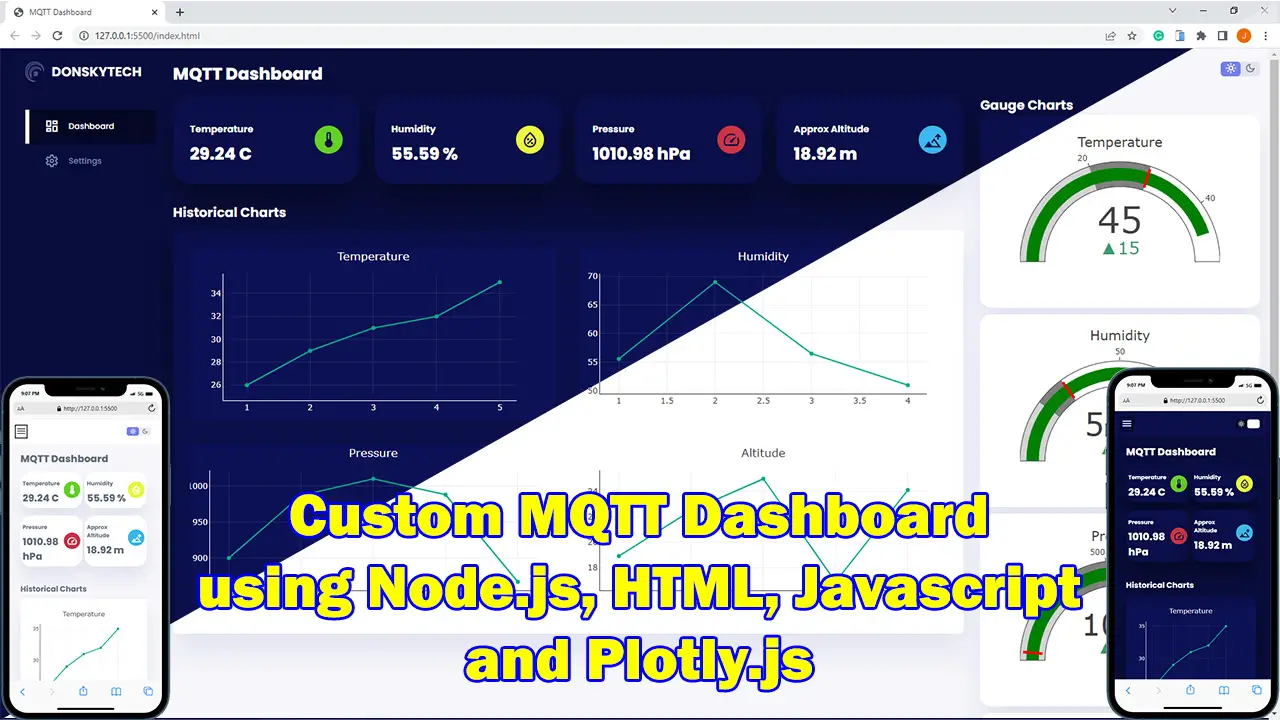
This post will show you how I built my own custom MQTT dashboard that will display MQTT messages using mqtt.js, Node.js, HTML, CSS, and Javascript.
If you want to see this project in a video format then please see below. You can also watch this on my YouTube channel.
What are we building?
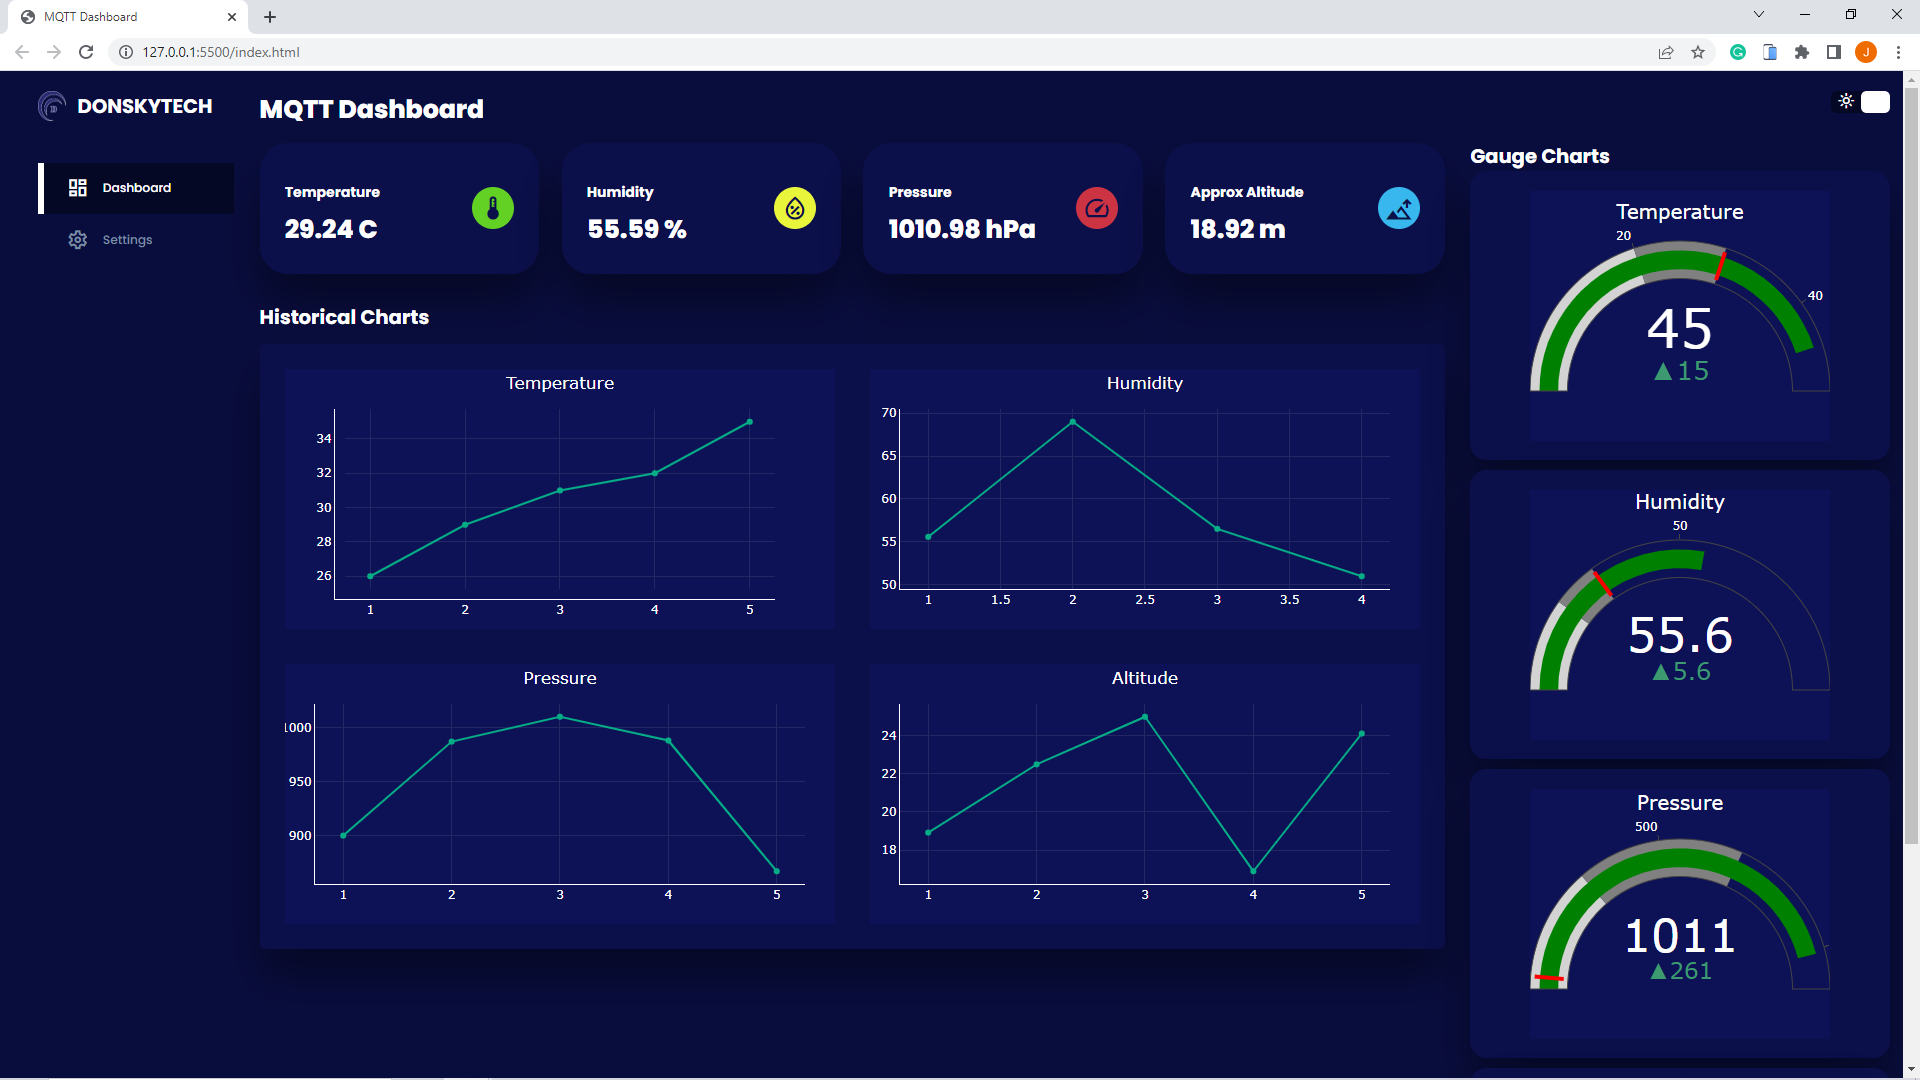
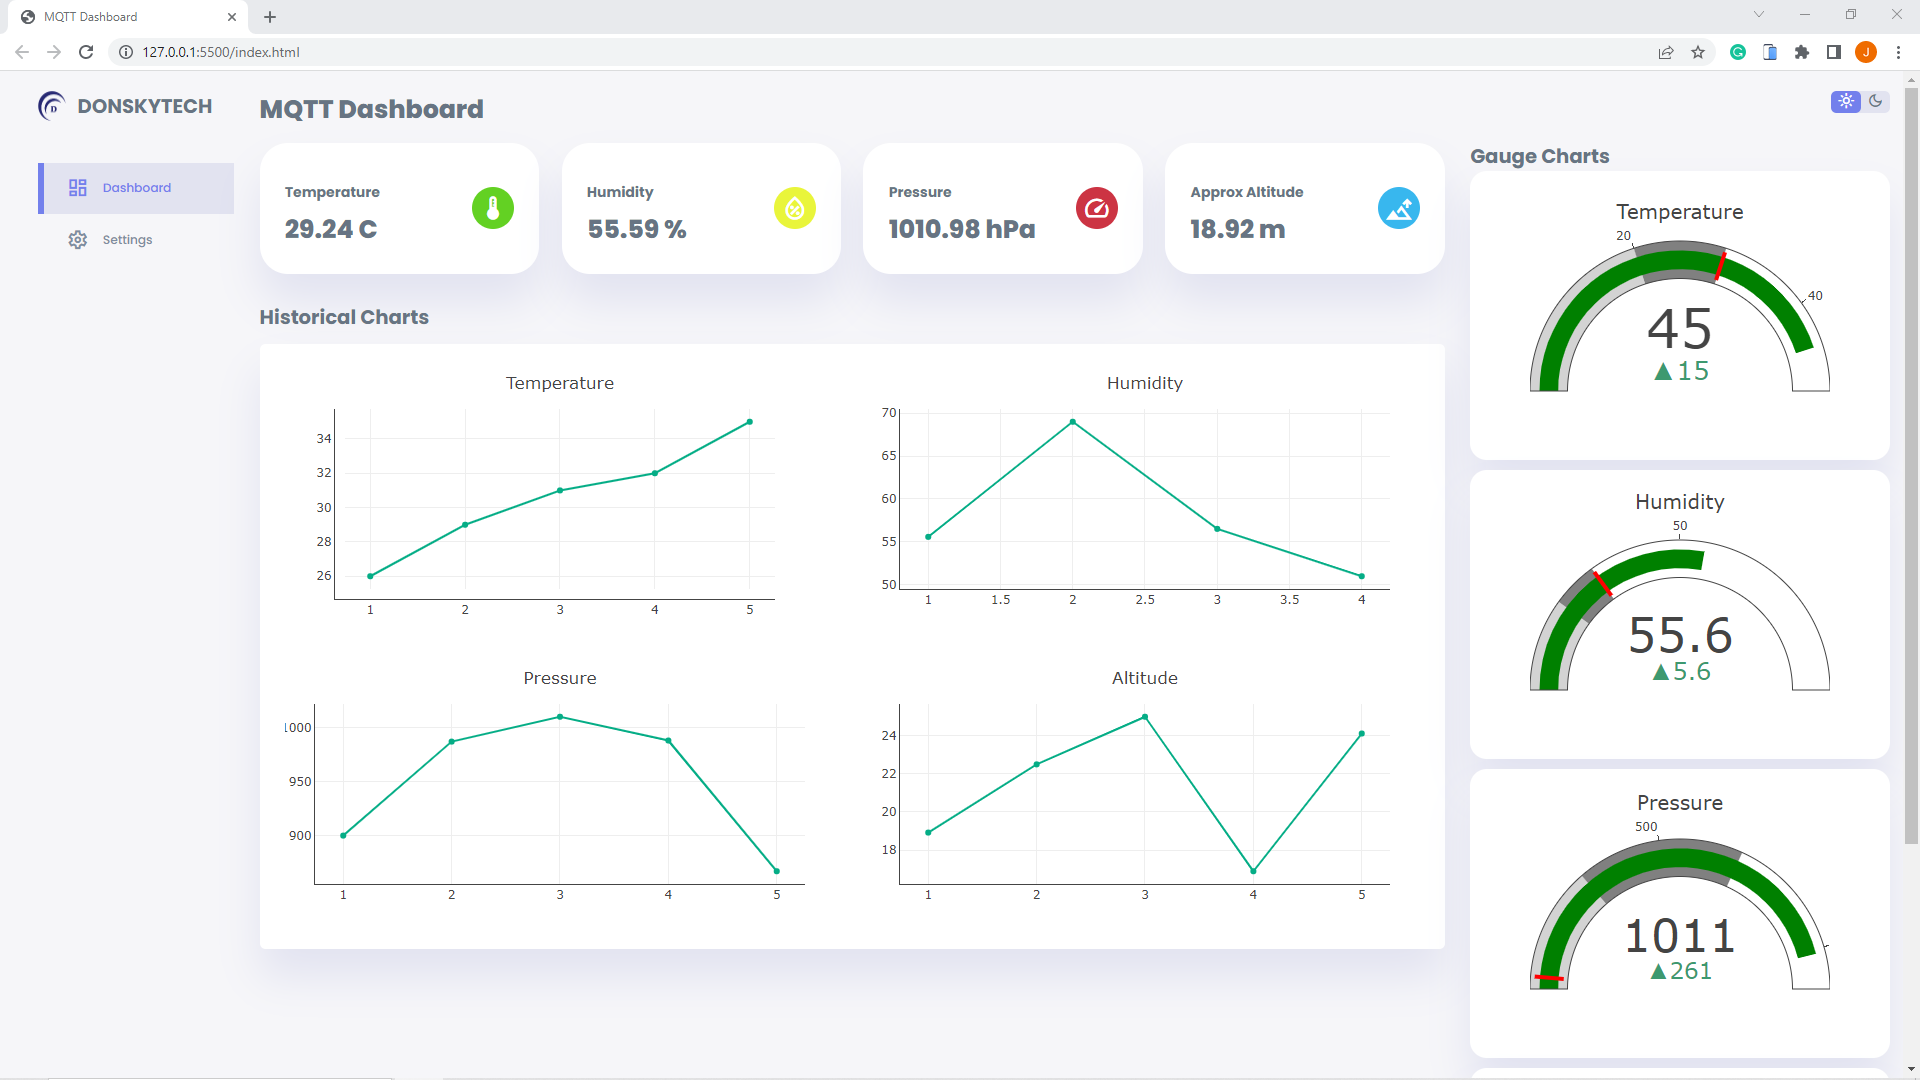
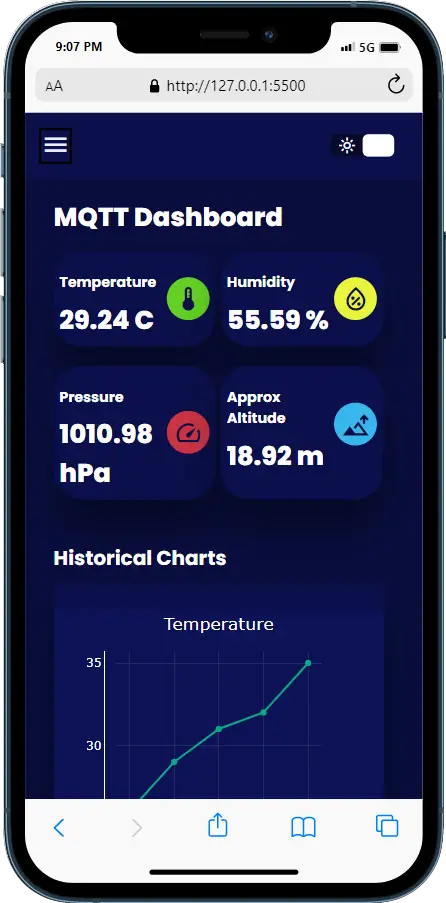
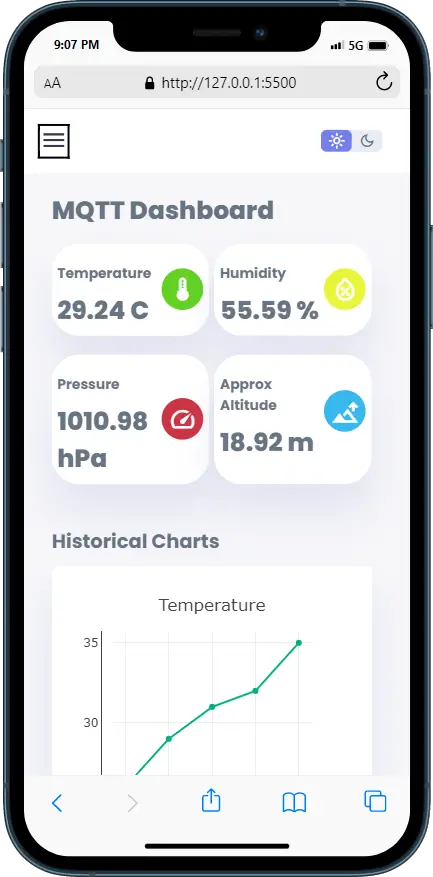
We are going to create a custom dashboard page that automatically updates itself for any MQTT message retrieved from our MQTT broker which is Mosquitto in this case. Also, we will support displaying a dark and light theme for our web applications, and must be responsive so that we can view it in a mobile browser
The following images below are sample user interfaces that we are gonna be displaying and we are going to display the readings from our fictitious sensor in both text and graphical charts.
Prerequisites
An MQTT broker that you can access that has WebSocket enabled. I am using a local Mosquitto MQTT broker installed on my laptop and have enabled WebSocket.
Related Content:
Install Mosquitto MQTT Windows
How to enable Websockets in Mosquitto MQTT broker?
You should have installed Node.js into your workstation and be familiar with the Express web framework. If you would like to learn more about this subject then please see the links below.
Related Content:
Install Node.js on Windows
MQTT using Node.js with practical examples
I am using Visual Studio Code in developing this whole project.
Custom MQTT Dashboard Project Design

The image above is the overall design of our application. The Mosquitto MQTT broker handles the MQTT messages between our MQTT Client and our web application built using Node.js and Express web framework.
Our web application talks to our Mosquitto broker thru WebSocket as browsers cannot talk directly to any MQTT broker without wrapping the MQTT messages in a WebSocket envelope. If you are not familiar with what WebSocket is and how it works then please read the links below.
Read Next:
Pico W -MicroPython MQTT – BMP/BME 280 Weather Station
Control DS18B20 using MicroPython with a Weather Station Project
I am using the library mqtt.js running in the browser to talk to my MQTT broker. To draw the graphs that will display my sensor readings then I am using the javascript library Plotly.js.
How to run the project?
The complete code for this project is available on my GitHub repository and you can either download the project or clone it using Git.
git clone https://github.com/donskytech/mqtt-custom-dashboard-node-js.git
cd mqtt-custom-dashboard-node-js
Install the dependencies and run the project.
npm install && npm run devRename the .env.local to .env
mv .env.local .envThis .env file contains the configurations of our project especially the URL or connection details of your MQTT broker. Edit the MQTT_BROKER and MQTT_TOPIC to point to your broker details and topic.
NAME=DONSKYTECH
DASHBOARD_TITLE=MQTT DASHBOARD
MQTT_BROKER=ws://127.0.01:9001/mqtt
MQTT_TOPIC=sensorReadings
Code
Project Layout
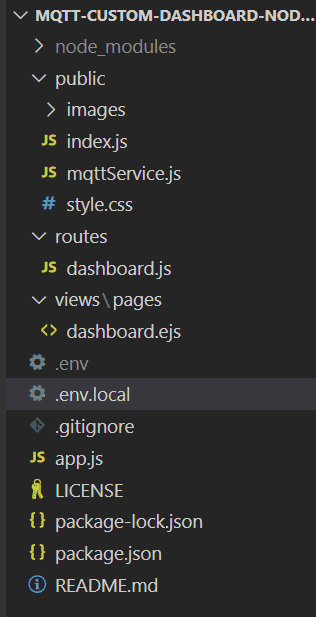
The image above contains the different files used in our custom MQTT dashboard application.
- app.js – contains our Express web server application
- routes/dashboard.js – the router that handles our web URL
- view/pages/dashboard.ejs – our EJS HTML file template that contains our web application
- public/images – contains our logo file
- public/mqttService.js – code to communicate to our MQTT broker
- public/index.js – code that draws our chart and calls the mqttService.js to communicate with our MQTT broker.
- public/style.css – styles our HTML template
- .env – contains our configurations
- package.json – contains our Node.js configurations and dependencies
Let us run through what each line of our code does.
app.js
const express = require("express");
const app = express();
const port = 3000;

// load dotenv to read environment variables
require("dotenv").config();

// template view engine
app.set("view engine", "ejs");

// Serve Static Files
app.use(express.static("public"));

//routes
const dashboardRouter = require("./routes/dashboard");

app.get("/mqttConnDetails", (req, res) => {
  res.send(
    JSON.stringify({
      mqttServer: process.env.MQTT_BROKER,
      mqttTopic: process.env.MQTT_TOPIC,
    })
  );
});

app.get("/", dashboardRouter);

app.listen(port, () => {
  console.log(`Example app listening on port ${port}`);
});
The app.js contains our Express web framework server code. I have commented on it heavily for you to know what each line of code does. The index.js is calling the route below to retrieve the MQTT connection details
app.get("/mqttConnDetails", (req, res) => {
  res.send(
    JSON.stringify({
      mqttServer: process.env.MQTT_BROKER,
      mqttTopic: process.env.MQTT_TOPIC,
    })
  );
});
routes/dashboard.js
The dashboard.js serves our home route and serves our EJS template file pages/dashboard.ejs. I am also using the .env configuration file to change the title of my page.
const express = require("express");
const router = express.Router();

// Home page - Dashboard.
router.get("/", function (req, res) {
  res.render("pages/dashboard", {
    name: process.env.NAME,
    dashboardTitle: process.env.DASHBOARD_TITLE,
  });
});

module.exports = router;
views/pages/dashboard.ejs
The dashboard.ejs file contains our HTML dashboard page. This YouTube video inspired me to follow the dashboard layout. I highly suggest that you watch that video tutorial as I have learned a lot from it also. I have edited the code there to suit my current needs.
<!DOCTYPE html>
<html lang="en">
  <head>
    <meta charset="UTF-8" />
    <meta http-equiv="X-UA-Compatible" content="IE=edge" />
    <meta name="viewport" content="width=device-width, initial-scale=1.0" />
    <title><%=dashboardTitle%></title>
    <link
      href="https://fonts.googleapis.com/icon?family=Material+Symbols+Sharp"
      rel="stylesheet"
    />
    <script src="https://cdn.plot.ly/plotly-2.16.1.min.js"></script>
    <script src="https://unpkg.com/mqtt/dist/mqtt.min.js"></script>
    <link rel="stylesheet" href="./style.css" />
  </head>
  <body>
    <div class="container">
      <aside>
        <div class="top">
          <div class="logo">
            <img src="images/logo.png" alt="" />
            <h2><%=name%></h2>
          </div>
          <div class="close" id="close-btn">
            <span class="material-symbols-sharp"> close </span>
          </div>
        </div>
        <div class="sidebar">
          <a href="#" class="active">
            <span class="material-symbols-sharp"> dashboard </span>
            <h3>Dashboard</h3>
          </a>
        </div>
      </aside>
      <main>
        <h1><%=dashboardTitle%></h1>
        <div class="connection-status">
          <h3>Connection Status: <span class="status">Disconnected</span></h3>
        </div>
        <div class="insights">
          <div class="temperature">
            <div class="middle">
              <div class="left">
                <h3>Temperature</h3>
                <h1 id="temperature"></h1>
              </div>
              <div class="icon">
                <span class="material-symbols-sharp"> device_thermostat </span>
              </div>
            </div>
          </div>
          <!-- End of temperature -->
          <div class="humidity">
            <div class="middle">
              <div class="left">
                <h3>Humidity</h3>
                <h1 id="humidity"></h1>
              </div>
              <div class="icon">
                <span class="material-symbols-sharp">
                  humidity_percentage
                </span>
              </div>
            </div>
          </div>
          <!-- End of humidity -->
          <div class="pressure">
            <div class="middle">
              <div class="left">
                <h3>Pressure</h3>
                <h1 id="pressure"></h1>
              </div>
              <div class="icon">
                <span class="material-symbols-sharp"> speed </span>
              </div>
            </div>
          </div>
          <!-- End of pressure -->
          <div class="altitude">
            <div class="middle">
              <div class="left">
                <h3>Approx Altitude</h3>
                <h1 id="altitude"></h1>
              </div>
              <div class="icon">
                <span class="material-symbols-sharp"> altitude </span>
              </div>
            </div>
          </div>
          <!-- End of altitude -->
        </div>
        <!-- End of Insights -->
        <div class="histories">
          <h2>Historical Charts</h2>
          <div class="history-charts">
            <div id="temperature-history" class="history-divs"></div>
            <div id="humidity-history" class="history-divs"></div>
            <div id="pressure-history" class="history-divs"></div>
            <div id="altitude-history" class="history-divs"></div>
          </div>
        </div>
      </main>
      <div class="right">
        <div class="top">
          <button id="menu-btn">
            <span class="material-symbols-sharp"> menu </span>
          </button>
          <div class="theme-toggler">
            <span class="material-symbols-sharp active"> light_mode </span>
            <span class="material-symbols-sharp"> dark_mode </span>
          </div>
        </div>
        <!-- End of top -->
        <div class="gauge-charts">
          <h2>Gauge Charts</h2>
          <div class="item">
            <div id="temperature-gauge"></div>
          </div>
          <div class="item">
            <div id="humidity-gauge"></div>
          </div>
          <div class="item">
            <div id="pressure-gauge"></div>
          </div>
          <div class="item">
            <div id="altitude-gauge"></div>
          </div>
        </div>
      </div>
    </div>
    <script type="module" src="./index.js"></script>
    <script type="module" src="./mqttService.js"></script>
  </body>
</html>
Let’s go through some of the important parts of this page.
<!DOCTYPE html>
<html lang="en">
  <head>
    <meta charset="UTF-8" />
    <meta http-equiv="X-UA-Compatible" content="IE=edge" />
    <meta name="viewport" content="width=device-width, initial-scale=1.0" />
    <title><%=dashboardTitle%></title>
    <link
      href="https://fonts.googleapis.com/icon?family=Material+Symbols+Sharp"
      rel="stylesheet"
    />
    <script src="https://cdn.plot.ly/plotly-2.16.1.min.js"></script>
    <script src="https://unpkg.com/mqtt/dist/mqtt.min.js"></script>
    <link rel="stylesheet" href="./style.css" />
  </head>
This is where we set some of the meta properties of our page and import the necessary font, scripts, and stylesheet. The Plotly.js and mqtt.js are imported here as well.
    <div class="container">
      <aside>
        <div class="top">
          <div class="logo">
            <img src="images/logo.png" alt="" />
            <h2><%=name%></h2>
          </div>
          <div class="close" id="close-btn">
            <span class="material-symbols-sharp"> close </span>
          </div>
        </div>
        <div class="sidebar">
          <a href="#" class="active">
            <span class="material-symbols-sharp"> dashboard </span>
            <h3>Dashboard</h3>
          </a>
        </div>
      </aside>
This is the code for my sidebar.
<main>
        <h1><%=dashboardTitle%></h1>
        <div class="connection-status">
          <h3>Connection Status: <span class="status">Disconnected</span></h3>
        </div>
        <div class="insights">
          <div class="temperature">
            <div class="middle">
              <div class="left">
                <h3>Temperature</h3>
                <h1 id="temperature"></h1>
              </div>
              <div class="icon">
                <span class="material-symbols-sharp"> device_thermostat </span>
              </div>
            </div>
          </div>
          <!-- End of temperature -->
          <div class="humidity">
            <div class="middle">
              <div class="left">
                <h3>Humidity</h3>
                <h1 id="humidity"></h1>
              </div>
              <div class="icon">
                <span class="material-symbols-sharp">
                  humidity_percentage
                </span>
              </div>
            </div>
          </div>
          <!-- End of humidity -->
          <div class="pressure">
            <div class="middle">
              <div class="left">
                <h3>Pressure</h3>
                <h1 id="pressure"></h1>
              </div>
              <div class="icon">
                <span class="material-symbols-sharp"> speed </span>
              </div>
            </div>
          </div>
          <!-- End of pressure -->
          <div class="altitude">
            <div class="middle">
              <div class="left">
                <h3>Approx Altitude</h3>
                <h1 id="altitude"></h1>
              </div>
              <div class="icon">
                <span class="material-symbols-sharp"> altitude </span>
              </div>
            </div>
          </div>
          <!-- End of altitude -->
        </div>
        <!-- End of Insights -->
The insight section shows the values of my current sensor readings which you can see in the middle of the page.
        <div class="histories">
          <h2>Historical Charts</h2>
          <div class="history-charts">
            <div id="temperature-history" class="history-divs"></div>
            <div id="humidity-history" class="history-divs"></div>
            <div id="pressure-history" class="history-divs"></div>
            <div id="altitude-history" class="history-divs"></div>
          </div>
        </div>
      </main>
These are placeholder div used to draw the historical charts of my page. Plotly.js will use these divs in creating the graphical charts.
<div class="right">
        <div class="top">
          <button id="menu-btn">
            <span class="material-symbols-sharp"> menu </span>
          </button>
          <div class="theme-toggler">
            <span class="material-symbols-sharp active"> light_mode </span>
            <span class="material-symbols-sharp"> dark_mode </span>
          </div>
        </div>
        <!-- End of top -->
        <div class="gauge-charts">
          <h2>Gauge Charts</h2>
          <div class="item">
            <div id="temperature-gauge"></div>
          </div>
          <div class="item">
            <div id="humidity-gauge"></div>
          </div>
          <div class="item">
            <div id="pressure-gauge"></div>
          </div>
          <div class="item">
            <div id="altitude-gauge"></div>
          </div>
        </div>
      </div>
    </div>
These will be used to display the gauge chart at the right side of the page where Plotly.js will manipulate these divs to draw the gauge charts.
  <script type="module" src="./index.js"></script>
    <script type="module" src="./mqttService.js"></script>
  </body>
</html>
We import our index.js and mqttService.js to manipulate the behavior of our page. Take note of the type="module" which means that the javascript files are using the ES6 module format.
public/mqttService.js
export class MQTTService {
  constructor(host, messageCallbacks) {
    this.mqttClient = null;
    this.host = host;
    this.messageCallbacks = messageCallbacks;
  }

  connect() {
    this.mqttClient = mqtt.connect(this.host);

    // MQTT Callback for 'error' event
    this.mqttClient.on("error", (err) => {
      console.log(err);
      this.mqttClient.end();
      if (this.messageCallbacks && this.messageCallbacks.onError)
        this.messageCallbacks.onError(err);
    });

    // MQTT Callback for 'connect' event
    this.mqttClient.on("connect", () => {
      console.log(`MQTT client connected`);
      if (this.messageCallbacks && this.messageCallbacks.onConnect) {
        this.messageCallbacks.onConnect("Connected");
      }
    });

    // Call the message callback function when message arrived
    this.mqttClient.on("message", (topic, message) => {
      if (this.messageCallbacks && this.messageCallbacks.onMessage) {
        this.messageCallbacks.onMessage(topic, message);
      }
    });

    this.mqttClient.on("close", () => {
      console.log(`MQTT client disconnected`);
      if (this.messageCallbacks && this.messageCallbacks.onClose)
        this.messageCallbacks.onClose();
    });
  }

  // Publish MQTT Message
  publish(topic, message, options) {
    this.mqttClient.publish(topic, message);
  }

  // Subscribe to MQTT Message
  subscribe(topic, options) {
    this.mqttClient.subscribe(topic, options);
  }
}
This is the file that communicates with our MQTT broker and it uses some of the API by mqtt.js.
export class MQTTService {
  constructor(host, messageCallbacks) {
    this.mqttClient = null;
    this.host = host;
    this.messageCallbacks = messageCallbacks;
  }
We export our MQTTService class as a module so that it can be used by other javascript files. The constructor section requires the host and the messageCallbacks that will be called whenever an event occurred during the connection to our MQTT broker.
  connect() {
    this.mqttClient = mqtt.connect(this.host);

    // MQTT Callback for 'error' event
    this.mqttClient.on("error", (err) => {
      console.log(err);
      this.mqttClient.end();
      if (this.messageCallbacks && this.messageCallbacks.onError)
        this.messageCallbacks.onError(err);
    });

    // MQTT Callback for 'connect' event
    this.mqttClient.on("connect", () => {
      console.log(`MQTT client connected`);
      if (this.messageCallbacks && this.messageCallbacks.onConnect) {
        this.messageCallbacks.onConnect("Connected");
      }
    });

    // Call the message callback function when message arrived
    this.mqttClient.on("message", (topic, message) => {
      if (this.messageCallbacks && this.messageCallbacks.onMessage) {
        this.messageCallbacks.onMessage(topic, message);
      }
    });

    this.mqttClient.on("close", () => {
      console.log(`MQTT client disconnected`);
      if (this.messageCallbacks && this.messageCallbacks.onClose)
        this.messageCallbacks.onClose();
    });
  }
The connect() method is used to connect to our MQTT broker wherein we are using them mqtt.connect() to retrieve an instance of the MQTTClient class of mqtt.js. Also, we define several callback functions that will be called whenever an event occurred like whenever we receive an MQTT message or the connection was successful or in error. The messageCallbacks is used to tell the caller of this class to run its own custom logic.
  // Publish MQTT Message
  publish(topic, message, options) {
    this.mqttClient.publish(topic, message);
  }

  // Subscribe to MQTT Message
  subscribe(topic, options) {
    this.mqttClient.subscribe(topic, options);
  }
}
These are methods used to publish and subscribe to MQTT topics using the mqtt.js API.
public/index.js
The majority of the core logic is handled by our index.js. Its main jobs consist of initiating our MQTT broker connection, drawing the Plotly.js graph, and handling the interactivity of our page.
// Import MQTT service
import { MQTTService } from "./mqttService.js";

// Target specific HTML items
const sideMenu = document.querySelector("aside");
const menuBtn = document.querySelector("#menu-btn");
const closeBtn = document.querySelector("#close-btn");
const themeToggler = document.querySelector(".theme-toggler");

// Holds the background color of all chart
var chartBGColor = getComputedStyle(document.body).getPropertyValue(
  "--chart-background"
);
var chartFontColor = getComputedStyle(document.body).getPropertyValue(
  "--chart-font-color"
);
var chartAxisColor = getComputedStyle(document.body).getPropertyValue(
  "--chart-axis-color"
);

/*
  Event listeners for any HTML click
*/
menuBtn.addEventListener("click", () => {
  sideMenu.style.display = "block";
});

closeBtn.addEventListener("click", () => {
  sideMenu.style.display = "none";
});

themeToggler.addEventListener("click", () => {
  document.body.classList.toggle("dark-theme-variables");
  themeToggler.querySelector("span:nth-child(1)").classList.toggle("active");
  themeToggler.querySelector("span:nth-child(2)").classList.toggle("active");

  // Update Chart background
  chartBGColor = getComputedStyle(document.body).getPropertyValue(
    "--chart-background"
  );
  chartFontColor = getComputedStyle(document.body).getPropertyValue(
    "--chart-font-color"
  );
  chartAxisColor = getComputedStyle(document.body).getPropertyValue(
    "--chart-axis-color"
  );
  updateChartsBackground();
});

/*
  Plotly.js graph and chart setup code
*/
var temperatureHistoryDiv = document.getElementById("temperature-history");
var humidityHistoryDiv = document.getElementById("humidity-history");
var pressureHistoryDiv = document.getElementById("pressure-history");
var altitudeHistoryDiv = document.getElementById("altitude-history");

var temperatureGaugeDiv = document.getElementById("temperature-gauge");
var humidityGaugeDiv = document.getElementById("humidity-gauge");
var pressureGaugeDiv = document.getElementById("pressure-gauge");
var altitudeGaugeDiv = document.getElementById("altitude-gauge");

const historyCharts = [
  temperatureHistoryDiv,
  humidityHistoryDiv,
  pressureHistoryDiv,
  altitudeHistoryDiv,
];

const gaugeCharts = [
  temperatureGaugeDiv,
  humidityGaugeDiv,
  pressureGaugeDiv,
  altitudeGaugeDiv,
];

// History Data
var temperatureTrace = {
  x: [],
  y: [],
  name: "Temperature",
  mode: "lines+markers",
  type: "line",
};
var humidityTrace = {
  x: [],
  y: [],
  name: "Humidity",
  mode: "lines+markers",
  type: "line",
};
var pressureTrace = {
  x: [],
  y: [],
  name: "Pressure",
  mode: "lines+markers",
  type: "line",
};
var altitudeTrace = {
  x: [],
  y: [],
  name: "Altitude",
  mode: "lines+markers",
  type: "line",
};

var temperatureLayout = {
  autosize: true,
  title: {
    text: "Temperature",
  },
  font: {
    size: 12,
    color: chartFontColor,
    family: "poppins, san-serif",
  },
  colorway: ["#05AD86"],
  margin: { t: 40, b: 40, l: 30, r: 30, pad: 10 },
  plot_bgcolor: chartBGColor,
  paper_bgcolor: chartBGColor,
  xaxis: {
    color: chartAxisColor,
    linecolor: chartAxisColor,
    gridwidth: "2",
    autorange: true,
  },
  yaxis: {
    color: chartAxisColor,
    linecolor: chartAxisColor,
    gridwidth: "2",
    autorange: true,
  },
};
var humidityLayout = {
  autosize: true,
  title: {
    text: "Humidity",
  },
  font: {
    size: 12,
    color: chartFontColor,
    family: "poppins, san-serif",
  },
  colorway: ["#05AD86"],
  margin: { t: 40, b: 40, l: 30, r: 30, pad: 0 },
  plot_bgcolor: chartBGColor,
  paper_bgcolor: chartBGColor,
  xaxis: {
    color: chartAxisColor,
    linecolor: chartAxisColor,
    gridwidth: "2",
  },
  yaxis: {
    color: chartAxisColor,
    linecolor: chartAxisColor,
  },
};
var pressureLayout = {
  autosize: true,
  title: {
    text: "Pressure",
  },
  font: {
    size: 12,
    color: chartFontColor,
    family: "poppins, san-serif",
  },
  colorway: ["#05AD86"],
  margin: { t: 40, b: 40, l: 30, r: 30, pad: 0 },
  plot_bgcolor: chartBGColor,
  paper_bgcolor: chartBGColor,
  xaxis: {
    color: chartAxisColor,
    linecolor: chartAxisColor,
    gridwidth: "2",
  },
  yaxis: {
    color: chartAxisColor,
    linecolor: chartAxisColor,
  },
};
var altitudeLayout = {
  autosize: true,
  title: {
    text: "Altitude",
  },
  font: {
    size: 12,
    color: chartFontColor,
    family: "poppins, san-serif",
  },
  colorway: ["#05AD86"],
  margin: { t: 40, b: 40, l: 30, r: 30, pad: 0 },
  plot_bgcolor: chartBGColor,
  paper_bgcolor: chartBGColor,
  xaxis: {
    color: chartAxisColor,
    linecolor: chartAxisColor,
    gridwidth: "2",
  },
  yaxis: {
    color: chartAxisColor,
    linecolor: chartAxisColor,
  },
};

var config = { responsive: true, displayModeBar: false };

// Event listener when page is loaded
window.addEventListener("load", (event) => {
  Plotly.newPlot(
    temperatureHistoryDiv,
    [temperatureTrace],
    temperatureLayout,
    config
  );
  Plotly.newPlot(humidityHistoryDiv, [humidityTrace], humidityLayout, config);
  Plotly.newPlot(pressureHistoryDiv, [pressureTrace], pressureLayout, config);
  Plotly.newPlot(altitudeHistoryDiv, [altitudeTrace], altitudeLayout, config);

  // Get MQTT Connection
  fetchMQTTConnection();

  // Run it initially
  handleDeviceChange(mediaQuery);
});

// Gauge Data
var temperatureData = [
  {
    domain: { x: [0, 1], y: [0, 1] },
    value: 0,
    title: { text: "Temperature" },
    type: "indicator",
    mode: "gauge+number+delta",
    delta: { reference: 30 },
    gauge: {
      axis: { range: [null, 50] },
      steps: [
        { range: [0, 20], color: "lightgray" },
        { range: [20, 30], color: "gray" },
      ],
      threshold: {
        line: { color: "red", width: 4 },
        thickness: 0.75,
        value: 30,
      },
    },
  },
];

var humidityData = [
  {
    domain: { x: [0, 1], y: [0, 1] },
    value: 0,
    title: { text: "Humidity" },
    type: "indicator",
    mode: "gauge+number+delta",
    delta: { reference: 50 },
    gauge: {
      axis: { range: [null, 100] },
      steps: [
        { range: [0, 20], color: "lightgray" },
        { range: [20, 30], color: "gray" },
      ],
      threshold: {
        line: { color: "red", width: 4 },
        thickness: 0.75,
        value: 30,
      },
    },
  },
];

var pressureData = [
  {
    domain: { x: [0, 1], y: [0, 1] },
    value: 0,
    title: { text: "Pressure" },
    type: "indicator",
    mode: "gauge+number+delta",
    delta: { reference: 750 },
    gauge: {
      axis: { range: [null, 1100] },
      steps: [
        { range: [0, 300], color: "lightgray" },
        { range: [300, 700], color: "gray" },
      ],
      threshold: {
        line: { color: "red", width: 4 },
        thickness: 0.75,
        value: 30,
      },
    },
  },
];

var altitudeData = [
  {
    domain: { x: [0, 1], y: [0, 1] },
    value: 0,
    title: { text: "Altitude" },
    type: "indicator",
    mode: "gauge+number+delta",
    delta: { reference: 60 },
    gauge: {
      axis: { range: [null, 150] },
      steps: [
        { range: [0, 50], color: "lightgray" },
        { range: [50, 100], color: "gray" },
      ],
      threshold: {
        line: { color: "red", width: 4 },
        thickness: 0.75,
        value: 30,
      },
    },
  },
];

var layout = { width: 300, height: 250, margin: { t: 0, b: 0, l: 0, r: 0 } };

Plotly.newPlot(temperatureGaugeDiv, temperatureData, layout);
Plotly.newPlot(humidityGaugeDiv, humidityData, layout);
Plotly.newPlot(pressureGaugeDiv, pressureData, layout);
Plotly.newPlot(altitudeGaugeDiv, altitudeData, layout);

// Will hold the arrays we receive from our BME280 sensor
// Temperature
let newTempXArray = [];
let newTempYArray = [];
// Humidity
let newHumidityXArray = [];
let newHumidityYArray = [];
// Pressure
let newPressureXArray = [];
let newPressureYArray = [];
// Altitude
let newAltitudeXArray = [];
let newAltitudeYArray = [];

// The maximum number of data points displayed on our scatter/line graph
let MAX_GRAPH_POINTS = 12;
let ctr = 0;

// Callback function that will retrieve our latest sensor readings and redraw our Gauge with the latest readings
function updateSensorReadings(jsonResponse) {
  console.log(typeof jsonResponse);
  console.log(jsonResponse);

  let temperature = Number(jsonResponse.temperature).toFixed(2);
  let humidity = Number(jsonResponse.humidity).toFixed(2);
  let pressure = Number(jsonResponse.pressure).toFixed(2);
  let altitude = Number(jsonResponse.altitude).toFixed(2);

  updateBoxes(temperature, humidity, pressure, altitude);

  updateGauge(temperature, humidity, pressure, altitude);

  // Update Temperature Line Chart
  updateCharts(
    temperatureHistoryDiv,
    newTempXArray,
    newTempYArray,
    temperature
  );
  // Update Humidity Line Chart
  updateCharts(
    humidityHistoryDiv,
    newHumidityXArray,
    newHumidityYArray,
    humidity
  );
  // Update Pressure Line Chart
  updateCharts(
    pressureHistoryDiv,
    newPressureXArray,
    newPressureYArray,
    pressure
  );

  // Update Altitude Line Chart
  updateCharts(
    altitudeHistoryDiv,
    newAltitudeXArray,
    newAltitudeYArray,
    altitude
  );
}

function updateBoxes(temperature, humidity, pressure, altitude) {
  let temperatureDiv = document.getElementById("temperature");
  let humidityDiv = document.getElementById("humidity");
  let pressureDiv = document.getElementById("pressure");
  let altitudeDiv = document.getElementById("altitude");

  temperatureDiv.innerHTML = temperature + " C";
  humidityDiv.innerHTML = humidity + " %";
  pressureDiv.innerHTML = pressure + " hPa";
  altitudeDiv.innerHTML = altitude + " m";
}

function updateGauge(temperature, humidity, pressure, altitude) {
  var temperature_update = {
    value: temperature,
  };
  var humidity_update = {
    value: humidity,
  };
  var pressure_update = {
    value: pressure,
  };
  var altitude_update = {
    value: altitude,
  };
  Plotly.update(temperatureGaugeDiv, temperature_update);
  Plotly.update(humidityGaugeDiv, humidity_update);
  Plotly.update(pressureGaugeDiv, pressure_update);
  Plotly.update(altitudeGaugeDiv, altitude_update);
}

function updateCharts(lineChartDiv, xArray, yArray, sensorRead) {
  if (xArray.length >= MAX_GRAPH_POINTS) {
    xArray.shift();
  }
  if (yArray.length >= MAX_GRAPH_POINTS) {
    yArray.shift();
  }
  xArray.push(ctr++);
  yArray.push(sensorRead);

  var data_update = {
    x: [xArray],
    y: [yArray],
  };

  Plotly.update(lineChartDiv, data_update);
}

function updateChartsBackground() {
  // updates the background color of historical charts
  var updateHistory = {
    plot_bgcolor: chartBGColor,
    paper_bgcolor: chartBGColor,
    font: {
      color: chartFontColor,
    },
    xaxis: {
      color: chartAxisColor,
      linecolor: chartAxisColor,
    },
    yaxis: {
      color: chartAxisColor,
      linecolor: chartAxisColor,
    },
  };
  historyCharts.forEach((chart) => Plotly.relayout(chart, updateHistory));

  // updates the background color of gauge charts
  var gaugeHistory = {
    plot_bgcolor: chartBGColor,
    paper_bgcolor: chartBGColor,
    font: {
      color: chartFontColor,
    },
    xaxis: {
      color: chartAxisColor,
      linecolor: chartAxisColor,
    },
    yaxis: {
      color: chartAxisColor,
      linecolor: chartAxisColor,
    },
  };
  gaugeCharts.forEach((chart) => Plotly.relayout(chart, gaugeHistory));
}

const mediaQuery = window.matchMedia("(max-width: 600px)");

mediaQuery.addEventListener("change", function (e) {
  handleDeviceChange(e);
});

function handleDeviceChange(e) {
  if (e.matches) {
    console.log("Inside Mobile");
    var updateHistory = {
      width: 323,
      height: 250,
      "xaxis.autorange": true,
      "yaxis.autorange": true,
    };
    historyCharts.forEach((chart) => Plotly.relayout(chart, updateHistory));
  } else {
    var updateHistory = {
      width: 550,
      height: 260,
      "xaxis.autorange": true,
      "yaxis.autorange": true,
    };
    historyCharts.forEach((chart) => Plotly.relayout(chart, updateHistory));
  }
}

/*
  MQTT Message Handling Code
*/
const mqttStatus = document.querySelector(".status");

function onConnect(message) {
  mqttStatus.textContent = "Connected";
}
function onMessage(topic, message) {
  var stringResponse = message.toString();
  var messageResponse = JSON.parse(stringResponse);
  updateSensorReadings(messageResponse);
}

function onError(error) {
  console.log(`Error encountered :: ${error}`);
  mqttStatus.textContent = "Error";
}

function onClose() {
  console.log(`MQTT connection closed!`);
  mqttStatus.textContent = "Closed";
}

function fetchMQTTConnection() {
  fetch("/mqttConnDetails", {
    method: "GET",
    headers: {
      "Content-type": "application/json; charset=UTF-8",
    },
  })
    .then(function (response) {
      return response.json();
    })
    .then(function (data) {
      initializeMQTTConnection(data.mqttServer, data.mqttTopic);
    })
    .catch((error) => console.error("Error getting MQTT Connection :", error));
}
function initializeMQTTConnection(mqttServer, mqttTopic) {
  console.log(
    `Initializing connection to :: ${mqttServer}, topic :: ${mqttTopic}`
  );
  var fnCallbacks = { onConnect, onMessage, onError, onClose };

  var mqttService = new MQTTService("ws://127.0.01:9001/mqtt", fnCallbacks);
  mqttService.connect();

  mqttService.subscribe("sensorReadings");
}
Let us subdivide each section so that we would know the function of each as this file contains quite a long code.
Add event listeners to different HTML components
// Import MQTT service
import { MQTTService } from "./mqttService.js";
We import our MQTTService class from our mqttService.js file
// Target specific HTML items
const sideMenu = document.querySelector("aside");
const menuBtn = document.querySelector("#menu-btn");
const closeBtn = document.querySelector("#close-btn");
const themeToggler = document.querySelector(".theme-toggler");

// Holds the background color of all chart
var chartBGColor = getComputedStyle(document.body).getPropertyValue(
  "--chart-background"
);
var chartFontColor = getComputedStyle(document.body).getPropertyValue(
  "--chart-font-color"
);
var chartAxisColor = getComputedStyle(document.body).getPropertyValue(
  "--chart-axis-color"
);
Set the variables to our HTML elements which we are going to manipulate later. Also, the background/font colors are extracted from our styling so that when we change our theme color then the graph background is changed also.
/*
  Event listeners for any HTML click
*/
menuBtn.addEventListener("click", () => {
  sideMenu.style.display = "block";
});

closeBtn.addEventListener("click", () => {
  sideMenu.style.display = "none";
});

themeToggler.addEventListener("click", () => {
  document.body.classList.toggle("dark-theme-variables");
  themeToggler.querySelector("span:nth-child(1)").classList.toggle("active");
  themeToggler.querySelector("span:nth-child(2)").classList.toggle("active");

  // Update Chart background
  chartBGColor = getComputedStyle(document.body).getPropertyValue(
    "--chart-background"
  );
  chartFontColor = getComputedStyle(document.body).getPropertyValue(
    "--chart-font-color"
  );
  chartAxisColor = getComputedStyle(document.body).getPropertyValue(
    "--chart-axis-color"
  );
  updateChartsBackground();
});
The different HTML components that need to respond to events like changing the theme background are assigned event listeners here. If you take a look at the themeToggler.addEventListener("click", () => { line then you would notice that I am changing the background of the different graphical charts here.
Initialize our Plotly.js Historical Charts
/*
  Plotly.js graph and chart setup code
*/
var temperatureHistoryDiv = document.getElementById("temperature-history");
var humidityHistoryDiv = document.getElementById("humidity-history");
var pressureHistoryDiv = document.getElementById("pressure-history");
var altitudeHistoryDiv = document.getElementById("altitude-history");

var temperatureGaugeDiv = document.getElementById("temperature-gauge");
var humidityGaugeDiv = document.getElementById("humidity-gauge");
var pressureGaugeDiv = document.getElementById("pressure-gauge");
var altitudeGaugeDiv = document.getElementById("altitude-gauge");

const historyCharts = [
  temperatureHistoryDiv,
  humidityHistoryDiv,
  pressureHistoryDiv,
  altitudeHistoryDiv,
];

const gaugeCharts = [
  temperatureGaugeDiv,
  humidityGaugeDiv,
  pressureGaugeDiv,
  altitudeGaugeDiv,
];

// History Data
var temperatureTrace = {
  x: [],
  y: [],
  name: "Temperature",
  mode: "lines+markers",
  type: "line",
};
var humidityTrace = {
  x: [],
  y: [],
  name: "Humidity",
  mode: "lines+markers",
  type: "line",
};
var pressureTrace = {
  x: [],
  y: [],
  name: "Pressure",
  mode: "lines+markers",
  type: "line",
};
var altitudeTrace = {
  x: [],
  y: [],
  name: "Altitude",
  mode: "lines+markers",
  type: "line",
};

var temperatureLayout = {
  autosize: true,
  title: {
    text: "Temperature",
  },
  font: {
    size: 12,
    color: chartFontColor,
    family: "poppins, san-serif",
  },
  colorway: ["#05AD86"],
  margin: { t: 40, b: 40, l: 30, r: 30, pad: 10 },
  plot_bgcolor: chartBGColor,
  paper_bgcolor: chartBGColor,
  xaxis: {
    color: chartAxisColor,
    linecolor: chartAxisColor,
    gridwidth: "2",
    autorange: true,
  },
  yaxis: {
    color: chartAxisColor,
    linecolor: chartAxisColor,
    gridwidth: "2",
    autorange: true,
  },
};
var humidityLayout = {
  autosize: true,
  title: {
    text: "Humidity",
  },
  font: {
    size: 12,
    color: chartFontColor,
    family: "poppins, san-serif",
  },
  colorway: ["#05AD86"],
  margin: { t: 40, b: 40, l: 30, r: 30, pad: 0 },
  plot_bgcolor: chartBGColor,
  paper_bgcolor: chartBGColor,
  xaxis: {
    color: chartAxisColor,
    linecolor: chartAxisColor,
    gridwidth: "2",
  },
  yaxis: {
    color: chartAxisColor,
    linecolor: chartAxisColor,
  },
};
var pressureLayout = {
  autosize: true,
  title: {
    text: "Pressure",
  },
  font: {
    size: 12,
    color: chartFontColor,
    family: "poppins, san-serif",
  },
  colorway: ["#05AD86"],
  margin: { t: 40, b: 40, l: 30, r: 30, pad: 0 },
  plot_bgcolor: chartBGColor,
  paper_bgcolor: chartBGColor,
  xaxis: {
    color: chartAxisColor,
    linecolor: chartAxisColor,
    gridwidth: "2",
  },
  yaxis: {
    color: chartAxisColor,
    linecolor: chartAxisColor,
  },
};
var altitudeLayout = {
  autosize: true,
  title: {
    text: "Altitude",
  },
  font: {
    size: 12,
    color: chartFontColor,
    family: "poppins, san-serif",
  },
  colorway: ["#05AD86"],
  margin: { t: 40, b: 40, l: 30, r: 30, pad: 0 },
  plot_bgcolor: chartBGColor,
  paper_bgcolor: chartBGColor,
  xaxis: {
    color: chartAxisColor,
    linecolor: chartAxisColor,
    gridwidth: "2",
  },
  yaxis: {
    color: chartAxisColor,
    linecolor: chartAxisColor,
  },
};

var config = { responsive: true, displayModeBar: false };
We define the different Plotly.js configurations here needed to draw our graphical charts. Each chart is assigned its own specific layout configurations so that we can alter each chart according to our needs.
// Event listener when page is loaded
window.addEventListener("load", (event) => {
  Plotly.newPlot(
    temperatureHistoryDiv,
    [temperatureTrace],
    temperatureLayout,
    config
  );
  Plotly.newPlot(humidityHistoryDiv, [humidityTrace], humidityLayout, config);
  Plotly.newPlot(pressureHistoryDiv, [pressureTrace], pressureLayout, config);
  Plotly.newPlot(altitudeHistoryDiv, [altitudeTrace], altitudeLayout, config);

  // Get MQTT Connection
  fetchMQTTConnection();

  // Run it initially
  handleDeviceChange(mediaQuery);
});
The code above runs whenever our web page successfully loads and its main job is to draw our graphical charts. In addition, we retrieve the MQTT connection details like the broker URL using the fetchMQTTConnection(). The handleDeviceChange(mediaQuery) is used to change the size of our graphs when viewed in a mobile browser.
Initialize our Plotly.js Gauge Charts
// Gauge Data
var temperatureData = [
  {
    domain: { x: [0, 1], y: [0, 1] },
    value: 0,
    title: { text: "Temperature" },
    type: "indicator",
    mode: "gauge+number+delta",
    delta: { reference: 30 },
    gauge: {
      axis: { range: [null, 50] },
      steps: [
        { range: [0, 20], color: "lightgray" },
        { range: [20, 30], color: "gray" },
      ],
      threshold: {
        line: { color: "red", width: 4 },
        thickness: 0.75,
        value: 30,
      },
    },
  },
];

var humidityData = [
  {
    domain: { x: [0, 1], y: [0, 1] },
    value: 0,
    title: { text: "Humidity" },
    type: "indicator",
    mode: "gauge+number+delta",
    delta: { reference: 50 },
    gauge: {
      axis: { range: [null, 100] },
      steps: [
        { range: [0, 20], color: "lightgray" },
        { range: [20, 30], color: "gray" },
      ],
      threshold: {
        line: { color: "red", width: 4 },
        thickness: 0.75,
        value: 30,
      },
    },
  },
];

var pressureData = [
  {
    domain: { x: [0, 1], y: [0, 1] },
    value: 0,
    title: { text: "Pressure" },
    type: "indicator",
    mode: "gauge+number+delta",
    delta: { reference: 750 },
    gauge: {
      axis: { range: [null, 1100] },
      steps: [
        { range: [0, 300], color: "lightgray" },
        { range: [300, 700], color: "gray" },
      ],
      threshold: {
        line: { color: "red", width: 4 },
        thickness: 0.75,
        value: 30,
      },
    },
  },
];

var altitudeData = [
  {
    domain: { x: [0, 1], y: [0, 1] },
    value: 0,
    title: { text: "Altitude" },
    type: "indicator",
    mode: "gauge+number+delta",
    delta: { reference: 60 },
    gauge: {
      axis: { range: [null, 150] },
      steps: [
        { range: [0, 50], color: "lightgray" },
        { range: [50, 100], color: "gray" },
      ],
      threshold: {
        line: { color: "red", width: 4 },
        thickness: 0.75,
        value: 30,
      },
    },
  },
];

var layout = { width: 300, height: 250, margin: { t: 0, b: 0, l: 0, r: 0 } };

Plotly.newPlot(temperatureGaugeDiv, temperatureData, layout);
Plotly.newPlot(humidityGaugeDiv, humidityData, layout);
Plotly.newPlot(pressureGaugeDiv, pressureData, layout);
Plotly.newPlot(altitudeGaugeDiv, altitudeData, layout);
The code above initializes our gauge charts. As you can see, we applied a separate layout for each gauge chart also so that we could alter its behavior independently.
Populate our Historical and Gauge Charts
// Will hold the arrays we receive from our BME280 sensor
// Temperature
let newTempXArray = [];
let newTempYArray = [];
// Humidity
let newHumidityXArray = [];
let newHumidityYArray = [];
// Pressure
let newPressureXArray = [];
let newPressureYArray = [];
// Altitude
let newAltitudeXArray = [];
let newAltitudeYArray = [];

// The maximum number of data points displayed on our scatter/line graph
let MAX_GRAPH_POINTS = 12;
let ctr = 0;

// Callback function that will retrieve our latest sensor readings and redraw our Gauge with the latest readings
function updateSensorReadings(jsonResponse) {
  console.log(typeof jsonResponse);
  console.log(jsonResponse);

  let temperature = Number(jsonResponse.temperature).toFixed(2);
  let humidity = Number(jsonResponse.humidity).toFixed(2);
  let pressure = Number(jsonResponse.pressure).toFixed(2);
  let altitude = Number(jsonResponse.altitude).toFixed(2);

  updateBoxes(temperature, humidity, pressure, altitude);

  updateGauge(temperature, humidity, pressure, altitude);

  // Update Temperature Line Chart
  updateCharts(
    temperatureHistoryDiv,
    newTempXArray,
    newTempYArray,
    temperature
  );
  // Update Humidity Line Chart
  updateCharts(
    humidityHistoryDiv,
    newHumidityXArray,
    newHumidityYArray,
    humidity
  );
  // Update Pressure Line Chart
  updateCharts(
    pressureHistoryDiv,
    newPressureXArray,
    newPressureYArray,
    pressure
  );

  // Update Altitude Line Chart
  updateCharts(
    altitudeHistoryDiv,
    newAltitudeXArray,
    newAltitudeYArray,
    altitude
  );
}

function updateBoxes(temperature, humidity, pressure, altitude) {
  let temperatureDiv = document.getElementById("temperature");
  let humidityDiv = document.getElementById("humidity");
  let pressureDiv = document.getElementById("pressure");
  let altitudeDiv = document.getElementById("altitude");

  temperatureDiv.innerHTML = temperature + " C";
  humidityDiv.innerHTML = humidity + " %";
  pressureDiv.innerHTML = pressure + " hPa";
  altitudeDiv.innerHTML = altitude + " m";
}

function updateGauge(temperature, humidity, pressure, altitude) {
  var temperature_update = {
    value: temperature,
  };
  var humidity_update = {
    value: humidity,
  };
  var pressure_update = {
    value: pressure,
  };
  var altitude_update = {
    value: altitude,
  };
  Plotly.update(temperatureGaugeDiv, temperature_update);
  Plotly.update(humidityGaugeDiv, humidity_update);
  Plotly.update(pressureGaugeDiv, pressure_update);
  Plotly.update(altitudeGaugeDiv, altitude_update);
}

function updateCharts(lineChartDiv, xArray, yArray, sensorRead) {
  if (xArray.length >= MAX_GRAPH_POINTS) {
    xArray.shift();
  }
  if (yArray.length >= MAX_GRAPH_POINTS) {
    yArray.shift();
  }
  xArray.push(ctr++);
  yArray.push(sensorRead);

  var data_update = {
    x: [xArray],
    y: [yArray],
  };

  Plotly.update(lineChartDiv, data_update);
}

function updateChartsBackground() {
  // updates the background color of historical charts
  var updateHistory = {
    plot_bgcolor: chartBGColor,
    paper_bgcolor: chartBGColor,
    font: {
      color: chartFontColor,
    },
    xaxis: {
      color: chartAxisColor,
      linecolor: chartAxisColor,
    },
    yaxis: {
      color: chartAxisColor,
      linecolor: chartAxisColor,
    },
  };
  historyCharts.forEach((chart) => Plotly.relayout(chart, updateHistory));

  // updates the background color of gauge charts
  var gaugeHistory = {
    plot_bgcolor: chartBGColor,
    paper_bgcolor: chartBGColor,
    font: {
      color: chartFontColor,
    },
    xaxis: {
      color: chartAxisColor,
      linecolor: chartAxisColor,
    },
    yaxis: {
      color: chartAxisColor,
      linecolor: chartAxisColor,
    },
  };
  gaugeCharts.forEach((chart) => Plotly.relayout(chart, gaugeHistory));
}
The code above handles how we are going to update the different parts of our web page such as the insights and graphs sections.
const mediaQuery = window.matchMedia("(max-width: 600px)");

mediaQuery.addEventListener("change", function (e) {
  handleDeviceChange(e);
});

function handleDeviceChange(e) {
  if (e.matches) {
    console.log("Inside Mobile");
    var updateHistory = {
      width: 323,
      height: 250,
      "xaxis.autorange": true,
      "yaxis.autorange": true,
    };
    historyCharts.forEach((chart) => Plotly.relayout(chart, updateHistory));
  } else {
    var updateHistory = {
      width: 550,
      height: 260,
      "xaxis.autorange": true,
      "yaxis.autorange": true,
    };
    historyCharts.forEach((chart) => Plotly.relayout(chart, updateHistory));
  }
}
We are using the code above to resize our graphical charts when viewed through our mobile browser. As such, we are querying the width of our device to know if this is being viewed in a mobile browser so that we can alter the dimensions of each graph.
MQTT Transaction handling
/*
  MQTT Message Handling Code
*/
const mqttStatus = document.querySelector(".status");

function onConnect(message) {
  mqttStatus.textContent = "Connected";
}
function onMessage(topic, message) {
  var stringResponse = message.toString();
  var messageResponse = JSON.parse(stringResponse);
  updateSensorReadings(messageResponse);
}

function onError(error) {
  console.log(`Error encountered :: ${error}`);
  mqttStatus.textContent = "Error";
}

function onClose() {
  console.log(`MQTT connection closed!`);
  mqttStatus.textContent = "Closed";
}

function fetchMQTTConnection() {
  fetch("/mqttConnDetails", {
    method: "GET",
    headers: {
      "Content-type": "application/json; charset=UTF-8",
    },
  })
    .then(function (response) {
      return response.json();
    })
    .then(function (data) {
      initializeMQTTConnection(data.mqttServer, data.mqttTopic);
    })
    .catch((error) => console.error("Error getting MQTT Connection :", error));
}
function initializeMQTTConnection(mqttServer, mqttTopic) {
  console.log(
    `Initializing connection to :: ${mqttServer}, topic :: ${mqttTopic}`
  );
  var fnCallbacks = { onConnect, onMessage, onError, onClose };

  var mqttService = new MQTTService("ws://127.0.01:9001/mqtt", fnCallbacks);
  mqttService.connect();

  mqttService.subscribe("sensorReadings");
}
The code above handles our MQTT transactions wherein we are manipulating the class MQTTService to connect and subscribe to our MQTT broker. The function onMessage() is of particular importance as this callback function is called whenever an MQTT message is received from the topic that we subscribed to and we used this message to update the contents of our dashboard page.
The fetchMQTTConnection() is needed to retrieve our MQTT connections from our server.
public/style.css
The style.css is used to stylize our HTML page wherein the core logic was taken from the YouTube video tutorial that I have quoted above. I highly suggest that you watch that video especially if you are not familiar with our CSS works.
Wrap up
We have successfully discussed the design and the code of how I created my own custom MQTT dashboard using Node.js, HTML, CSS, and JavaScript. We were able to utilize mqtt.js to communicate with our MQTT broker and use Plotly.js to draw our charts.
I hope you learn something! Happy Exploring!
Leave a Reply