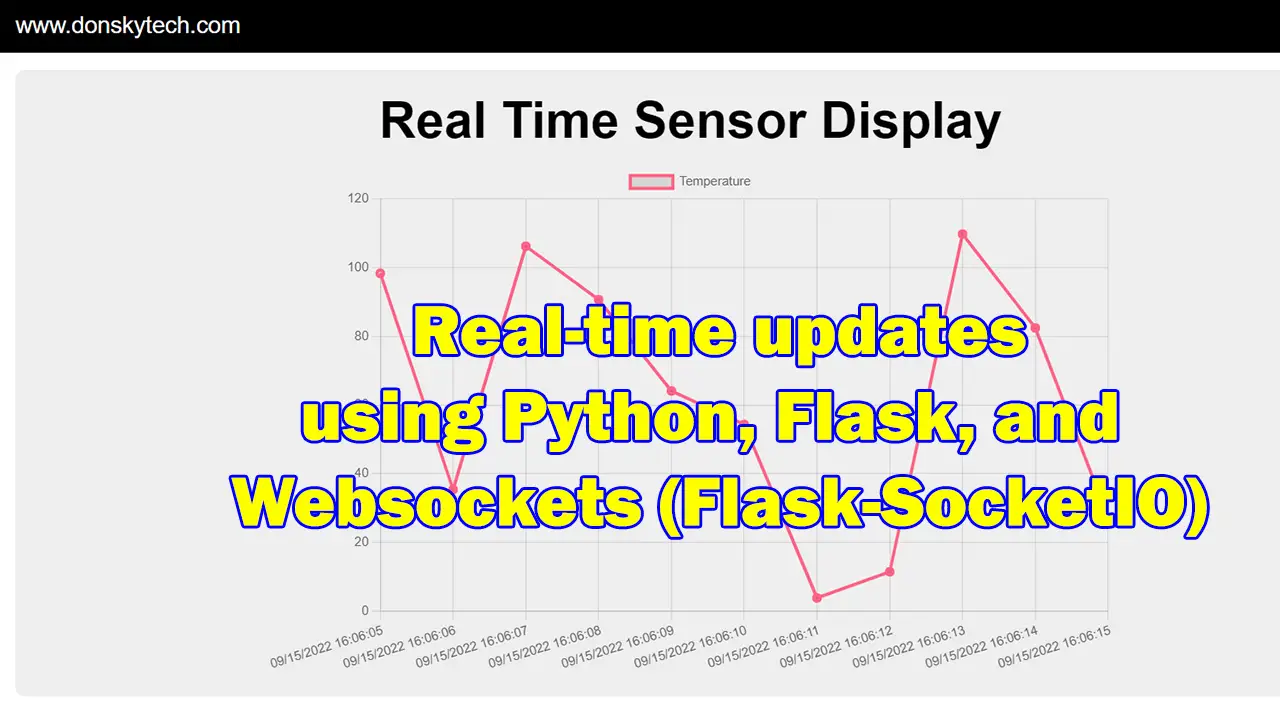
Introduction
Do you need to display real-time updates coming from your server into your HTML page then using Websocket is a good option. In this post, we will explore Python, Flask, and Websocket to display sensor values coming from our server on our page and show it as a graphical chart. We will be using Flask-SocketIO to configure the bidirectional real-time exchange of Websocket messages between our server and our HTML page. We will then use Chart.js to draw a line chart of our sensor reads.
If you like video tutorials and would like to see this in action then please see the video below or watch it on my YouTube channel.
What is WebSocket?
Using HTTP (Hypertext Transfer Protocol) as a means to show information in near real-time presents some overhead in terms of the transfer speed. Applications that display information like Stock Market price values or Sensor Display in Internet of Things (IoT) projects require a real-time exchange of information between the server and the client.
This is where WebSocket comes into the picture as a means of sending information in a bi-directional way with little overhead. If you want to read more about how WebSocket can be used in an IoT project then please see the below post.
Read More:
Using WebSocket in the Internet of Things (IoT) projects
Python, Flask, and Flask-SocketIO
I was trying to figure out a way how to display my sensor values in near real-time to my users using my existing Flask application. If you are not familiar with Flask then take a look at my post about how you can get started with Flask using my Raspberry Pi. If you do not have a Raspberry Pi but you have Python installed on your laptop then you could still follow that post.
Related Content:
Raspberry Pi and Flask Quickstart Guide
I saw that there was an implementation with this Flask-SocketIO so I did try making a small project out of it. The example section gives me a headstart on the GitHub page of the project.
I then tried to use this Chart.js in displaying my values in a line chart. I was not expecting that this would be easy so I thought of sharing this with you.
The Information page of the Chart.js javascript library helped me figure out how to populate the dataset. The documentation of the Flask-SocketIO is a good read if ever you get stuck on some problem.
Code
The code for this project is available in my GitHub repository and you can access it from here. You can either clone the project or download it in a zip file and then open it in Visual Studio Code.
If you are in Windows and don’t have Visual Studio Code installed then you can follow my Install Visual Studio Code or VSCode in Windows.
Below are the steps on how to configure it and the relevant explanation of each part of the code. I will try to explain the Python, Flask, and WebSocket wrapper library Flask-SocketIO in the below sections as much as I can.
Setup
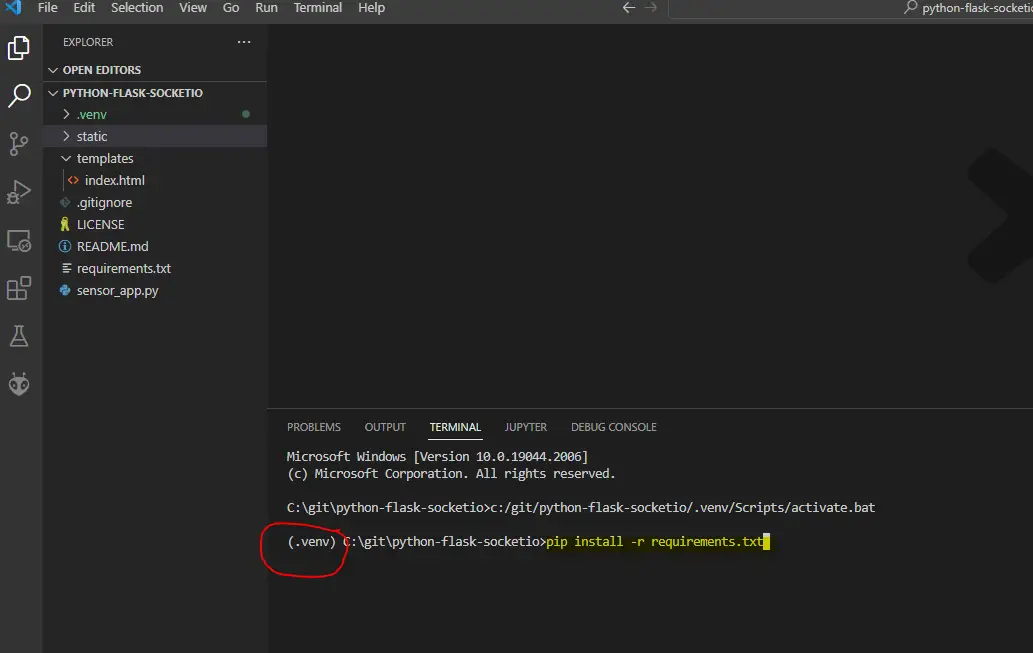
Open a terminal in Visual Studio Code and create a Python virtual environment by executing the below command. This will automatically create a folder named .venv where the local Python environment is created separate from your global Python installation folder.
python -m venv .venvVisual studio code will automatically detect this new environment. If not, open a new terminal then install the dependencies by executing the below code.
pip install -r requirements.txtYou should be seeing the following on your terminal.
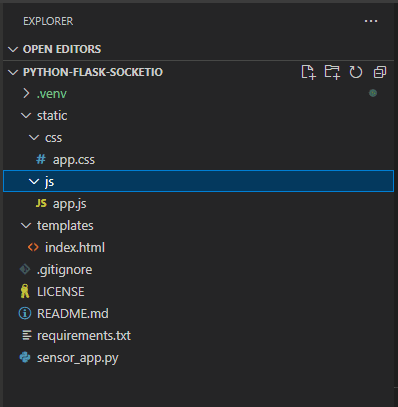
Let us scan what files are in our project and discuss each line.
- sensor_app.py – contains our Flask and Flask-SocketIO Websockets server
- index.html – page to display our graph
- app.js – javascript code to handle the WebSocket messages coming from the server
- app.css – custom styling
sensor_app.py
The following file is our Python Flask WebSocket server. Let us discuss what each line of code does.
from flask import Flask, render_template, request
from flask_socketio import SocketIO
from random import random
from threading import Lock
from datetime import datetime

"""
Background Thread
"""
thread = None
thread_lock = Lock()

app = Flask(__name__)
app.config['SECRET_KEY'] = 'donsky!'
socketio = SocketIO(app, cors_allowed_origins='*')

"""
Get current date time
"""
def get_current_datetime():
    now = datetime.now()
    return now.strftime("%m/%d/%Y %H:%M:%S")

"""
Generate random sequence of dummy sensor values and send it to our clients
"""
def background_thread():
    print("Generating random sensor values")
    while True:
        dummy_sensor_value = round(random() * 100, 3)
        socketio.emit('updateSensorData', {'value': dummy_sensor_value, "date": get_current_datetime()})
        socketio.sleep(1)

"""
Serve root index file
"""
@app.route('/')
def index():
    return render_template('index.html')

"""
Decorator for connect
"""
@socketio.on('connect')
def connect():
    global thread
    print('Client connected')

    global thread
    with thread_lock:
        if thread is None:
            thread = socketio.start_background_task(background_thread)

"""
Decorator for disconnect
"""
@socketio.on('disconnect')
def disconnect():
    print('Client disconnected',  request.sid)

if __name__ == '__main__':
    socketio.run(app)
from flask import Flask, render_template, request
from flask_socketio import SocketIO
from random import random
from threading import Lock
from datetime import datetimeThe necessary modules and package imports
"""
Background Thread
"""
thread = None
thread_lock = Lock()

app = Flask(__name__)
app.config['SECRET_KEY'] = 'donsky!'
socketio = SocketIO(app, cors_allowed_origins='*')
Define the background thread that will send the dummy sensor values. We initialize our Flask App here and the SocketIO WebSocket server.
"""
Get current date time
"""
def get_current_datetime():
    now = datetime.now()
    return now.strftime("%m/%d/%Y %H:%M:%S")
Function to get the current date time. We will use this as a label for our graph.
"""
Generate random sequence of dummy sensor values and send it to our clients
"""
def background_thread():
    print("Generating random sensor values")
    while True:
        dummy_sensor_value = round(random() * 100, 3)
        socketio.emit('updateSensorData', {'value': dummy_sensor_value, "date": get_current_datetime()})
        socketio.sleep(1)

"""
The background thread generates dummy sensor values and sends them to all WebSocket clients by calling the socketio.emit()
"""
Serve root index file
"""
@app.route('/')
def index():
    return render_template('index.html')

"""
Decorator for connect
"""
@socketio.on('connect')
def connect():
    global thread
    print('Client connected')

    global thread
    with thread_lock:
        if thread is None:
            thread = socketio.start_background_task(background_thread)

"""
Decorator for disconnect
"""
@socketio.on('disconnect')
def disconnect():
    print('Client disconnected',  request.sid)

if __name__ == '__main__':
    socketio.run(app)
Standard Flask routes that display the root page. The connect() and disconnect() are decorated with SocketIO. The background thread is initialized here so that it runs when the first WebSocket client connects.
index.html
The following is our page that displays the graph.
I am using the following mincss Cascading Style Sheet (CSS) framework to beautify my user interface a little bit. This is a small CSS framework to use.
I am using Chart.js in displaying the graph as I found it to be simple to use.
<!DOCTYPE html>
<html>
  <head>
    <meta charset="UTF-8" />
    <meta name="viewport" content="width=device-width, initial-scale=1" />
    <title>Real Time Sensor Display Using Python, Flask, Flask-SocketIO</title>

    <script src="https://cdnjs.cloudflare.com/ajax/libs/jquery/3.5.1/jquery.min.js" integrity="sha512-bLT0Qm9VnAYZDflyKcBaQ2gg0hSYNQrJ8RilYldYQ1FxQYoCLtUjuuRuZo+fjqhx/qtq/1itJ0C2ejDxltZVFg==" crossorigin="anonymous"></script>
    <script src="https://cdnjs.cloudflare.com/ajax/libs/socket.io/3.0.4/socket.io.js" integrity="sha512-aMGMvNYu8Ue4G+fHa359jcPb1u+ytAF+P2SCb+PxrjCdO3n3ZTxJ30zuH39rimUggmTwmh2u7wvQsDTHESnmfQ==" crossorigin="anonymous"></script>
    <script src="https://cdnjs.cloudflare.com/ajax/libs/Chart.js/3.7.1/chart.min.js"></script>
    <link
      href="//mincss.com/entireframework.min.css"
      rel="stylesheet"
      type="text/css"
    />
    <link href="{{url_for('static', filename = 'css/app.css')}}" rel="stylesheet">
  </head>
  <body>
    <script type="text/javascript" src="{{ url_for('static', filename = 'js/app.js') }}"></script>

    <nav class="nav" tabindex="-1" onclick="this.focus()">
      <div class="container">
        <a class="pagename current" href="#">www.donskytech.com</a>
      </div>
    </nav>
    <button class="btn-close btn btn-sm">×</button>
    <div class="container">
      <div class="hero">
        <h1>Real Time Sensor Display</h1>
        <div class="chart-container">
          <canvas id="myChart" width="1000" height="600"></canvas>
        </div>
      </div>
    </div>
  </body>
</html>
The important part of this HTML is the below lines. This is where we display an HTML5 canvas that Chart.js uses to display the line graph.
<div class="container">
      <div class="hero">
        <h1>Real Time Sensor Display</h1>
        <div class="chart-container">
          <canvas id="myChart" width="1000" height="600"></canvas>
        </div>
      </div>
app.js
This is the javascript file that handles the WebSocket messages and updates the values in our chart. Let us go through what each line of the code does.
$(document).ready(function () {
  const ctx = document.getElementById("myChart").getContext("2d");

  const myChart = new Chart(ctx, {
    type: "line",
    data: {
      datasets: [{ label: "Temperature",  }],
    },
    options: {
      borderWidth: 3,
      borderColor: ['rgba(255, 99, 132, 1)',],
    },
  });

  function addData(label, data) {
    myChart.data.labels.push(label);
    myChart.data.datasets.forEach((dataset) => {
      dataset.data.push(data);
    });
    myChart.update();
  }

  function removeFirstData() {
    myChart.data.labels.splice(0, 1);
    myChart.data.datasets.forEach((dataset) => {
      dataset.data.shift();
    });
  }

  const MAX_DATA_COUNT = 10;
  //connect to the socket server.
  //   var socket = io.connect("http://" + document.domain + ":" + location.port);
  var socket = io.connect();

  //receive details from server
  socket.on("updateSensorData", function (msg) {
    console.log("Received sensorData :: " + msg.date + " :: " + msg.value);

    // Show only MAX_DATA_COUNT data
    if (myChart.data.labels.length > MAX_DATA_COUNT) {
      removeFirstData();
    }
    addData(msg.date, msg.value);
  });
});
  const ctx = document.getElementById("myChart").getContext("2d");

  const myChart = new Chart(ctx, {
    type: "line",
    data: {
      datasets: [{ label: "Temperature",  }],
    },
    options: {
      borderWidth: 3,
      borderColor: ['rgba(255, 99, 132, 1)',],
    },
  });
We define the chart at this point and configure the general settings.
  function addData(label, data) {
    myChart.data.labels.push(label);
    myChart.data.datasets.forEach((dataset) => {
      dataset.data.push(data);
    });
    myChart.update();
  }

  function removeFirstData() {
    myChart.data.labels.splice(0, 1);
    myChart.data.datasets.forEach((dataset) => {
      dataset.data.shift();
    });
  }
Adding and removing data for each dataset is done by these two functions.
  const MAX_DATA_COUNT = 10;
  //connect to the socket server.
  //   var socket = io.connect("http://" + document.domain + ":" + location.port);
  var socket = io.connect();

  //receive details from server
  socket.on("updateSensorData", function (msg) {
    console.log("Received sensorData :: " + msg.date + " :: " + msg.value);

    // Show only MAX_DATA_COUNT data
    if (myChart.data.labels.length > MAX_DATA_COUNT) {
      removeFirstData();
    }
    addData(msg.date, msg.value);
  });
Websocket connection and configuration are done by the code above. When we receive the event updateSensorData then we check if the maximum length of data is already displayed. If it is, then we remove the first record and then add the new value.
app.css
These are our custom stylesheet selectors to have a better view.
.hero {
    background: #eee;
    padding: 20px;
    border-radius: 10px;
    margin-top: 1em;
}

.hero h1 {
    margin-top: 0;
    margin-bottom: 0.3em;
    text-align: center;
}


.chart-container {
	max-width: 800px;
	margin: 0 auto;
}
That is all for the code! Yay!
Practical Python, Flask, Flask-SocketIO Projects
I have used the idea in this post on some of my Internet of Things (IoT) projects.
DHT22 Weather Station Project
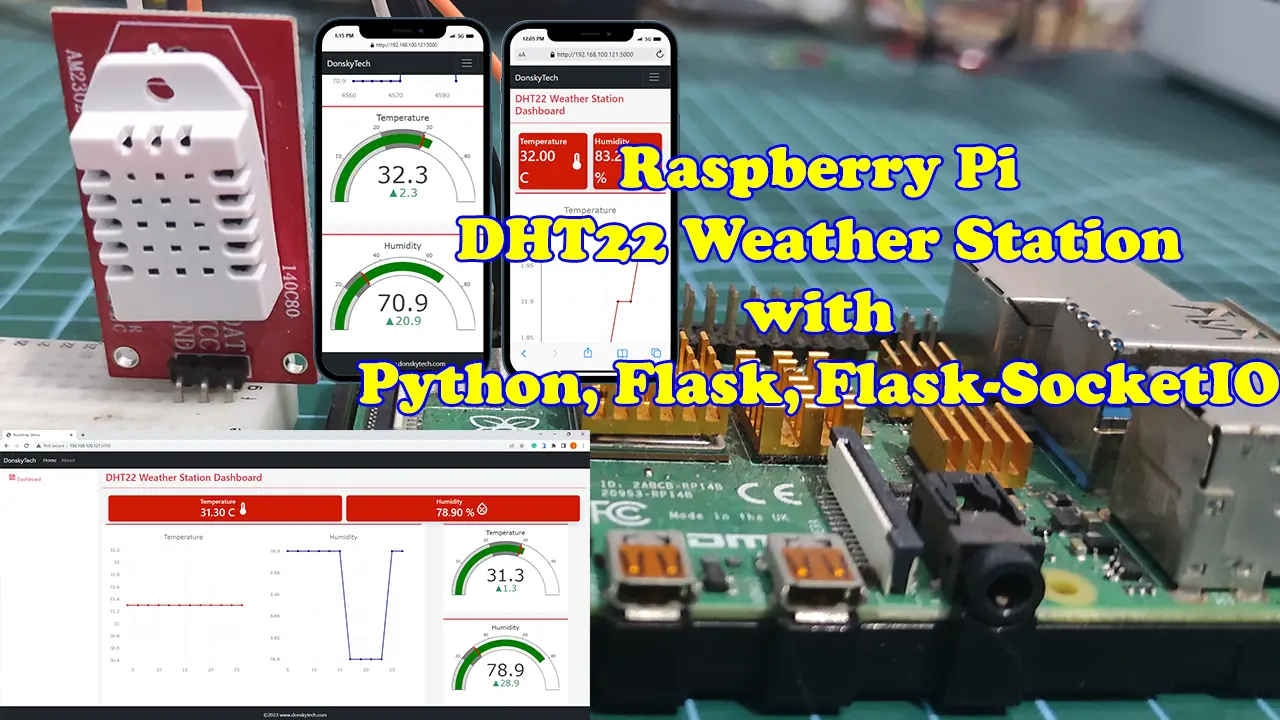
I wanted to display the sensor readings of my DHT22 weather station so I have used the concept that I have learned from here in developing this project.
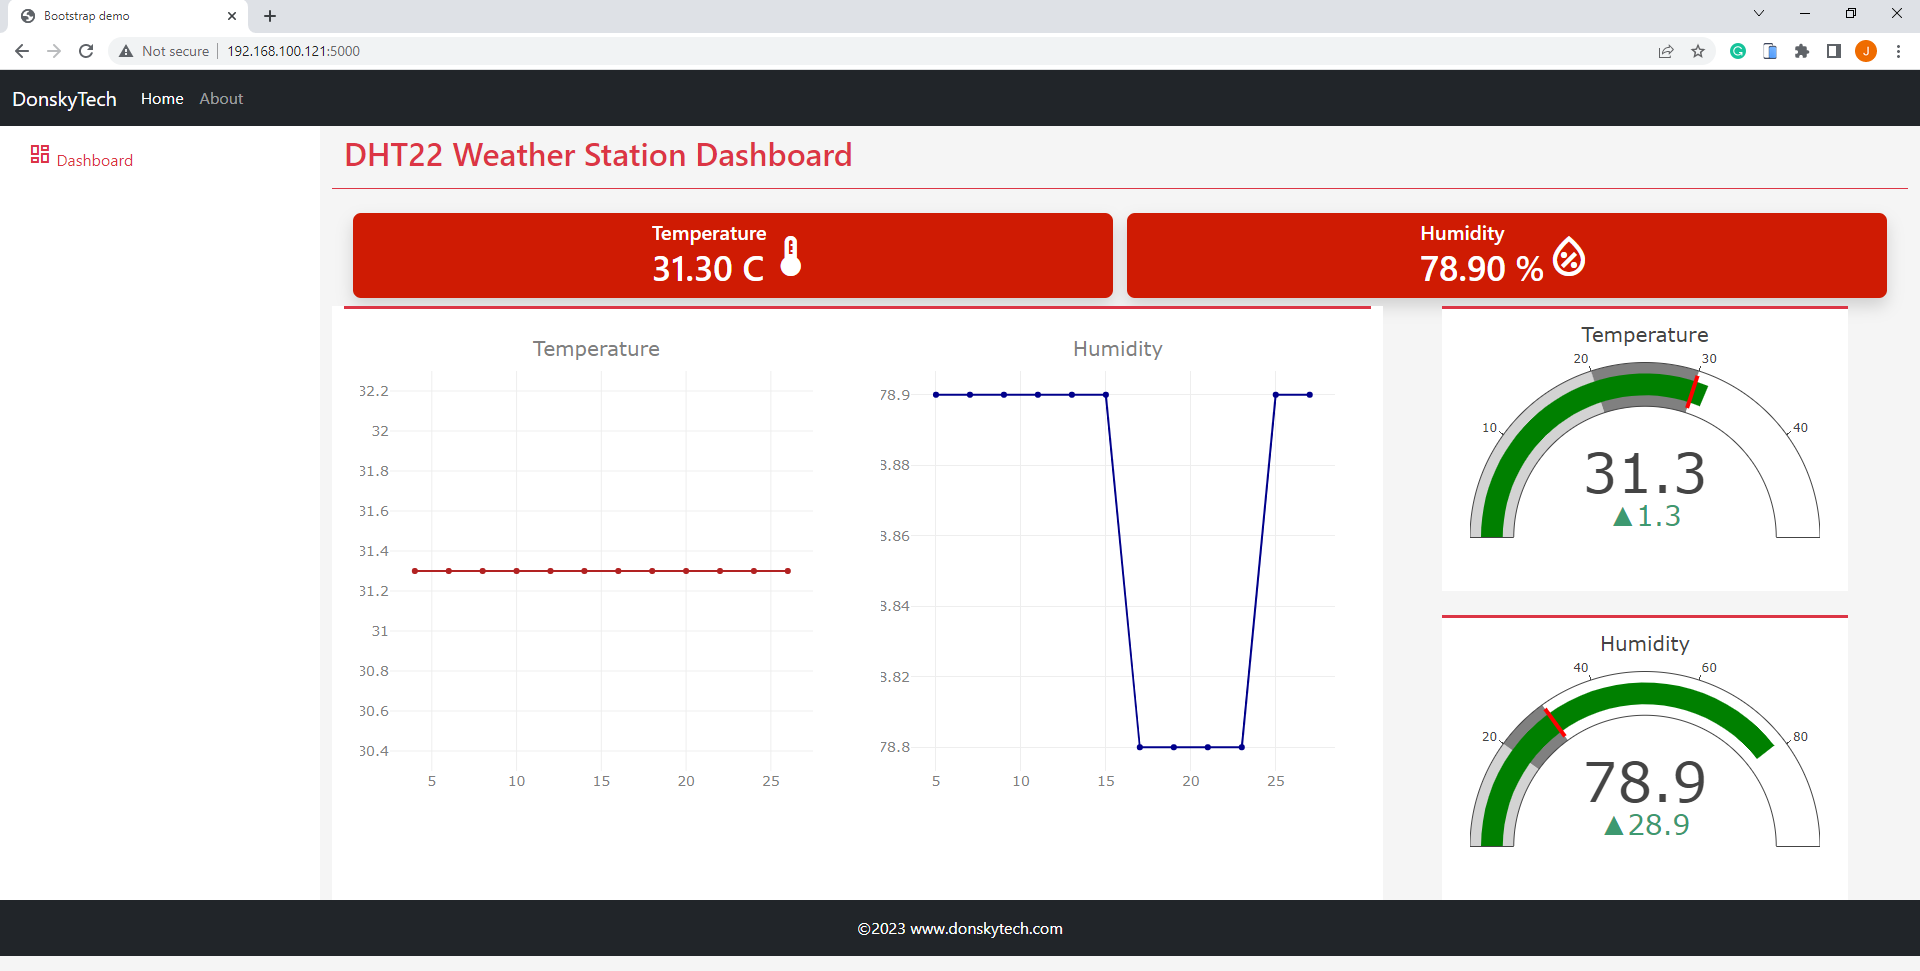
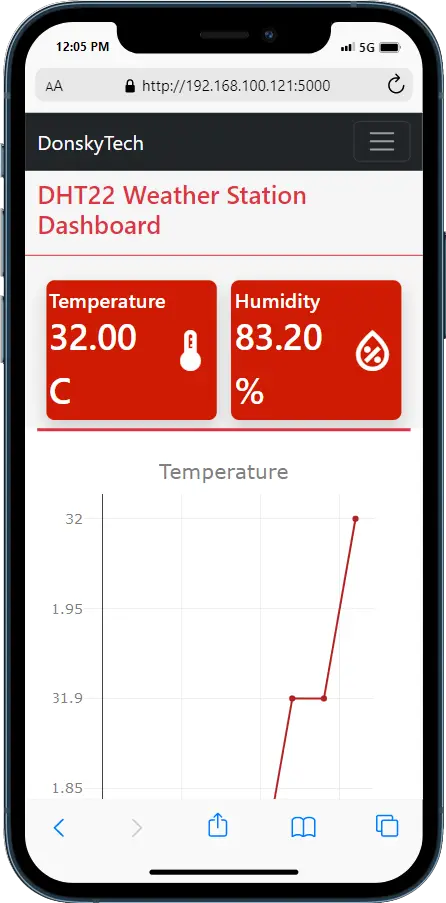
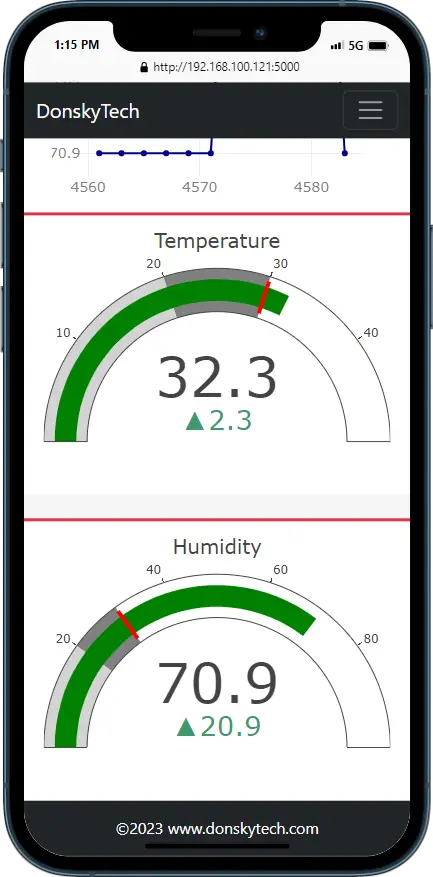
For more details about this project then please see the following Raspberry Pi DHT22 Weather Station Project.
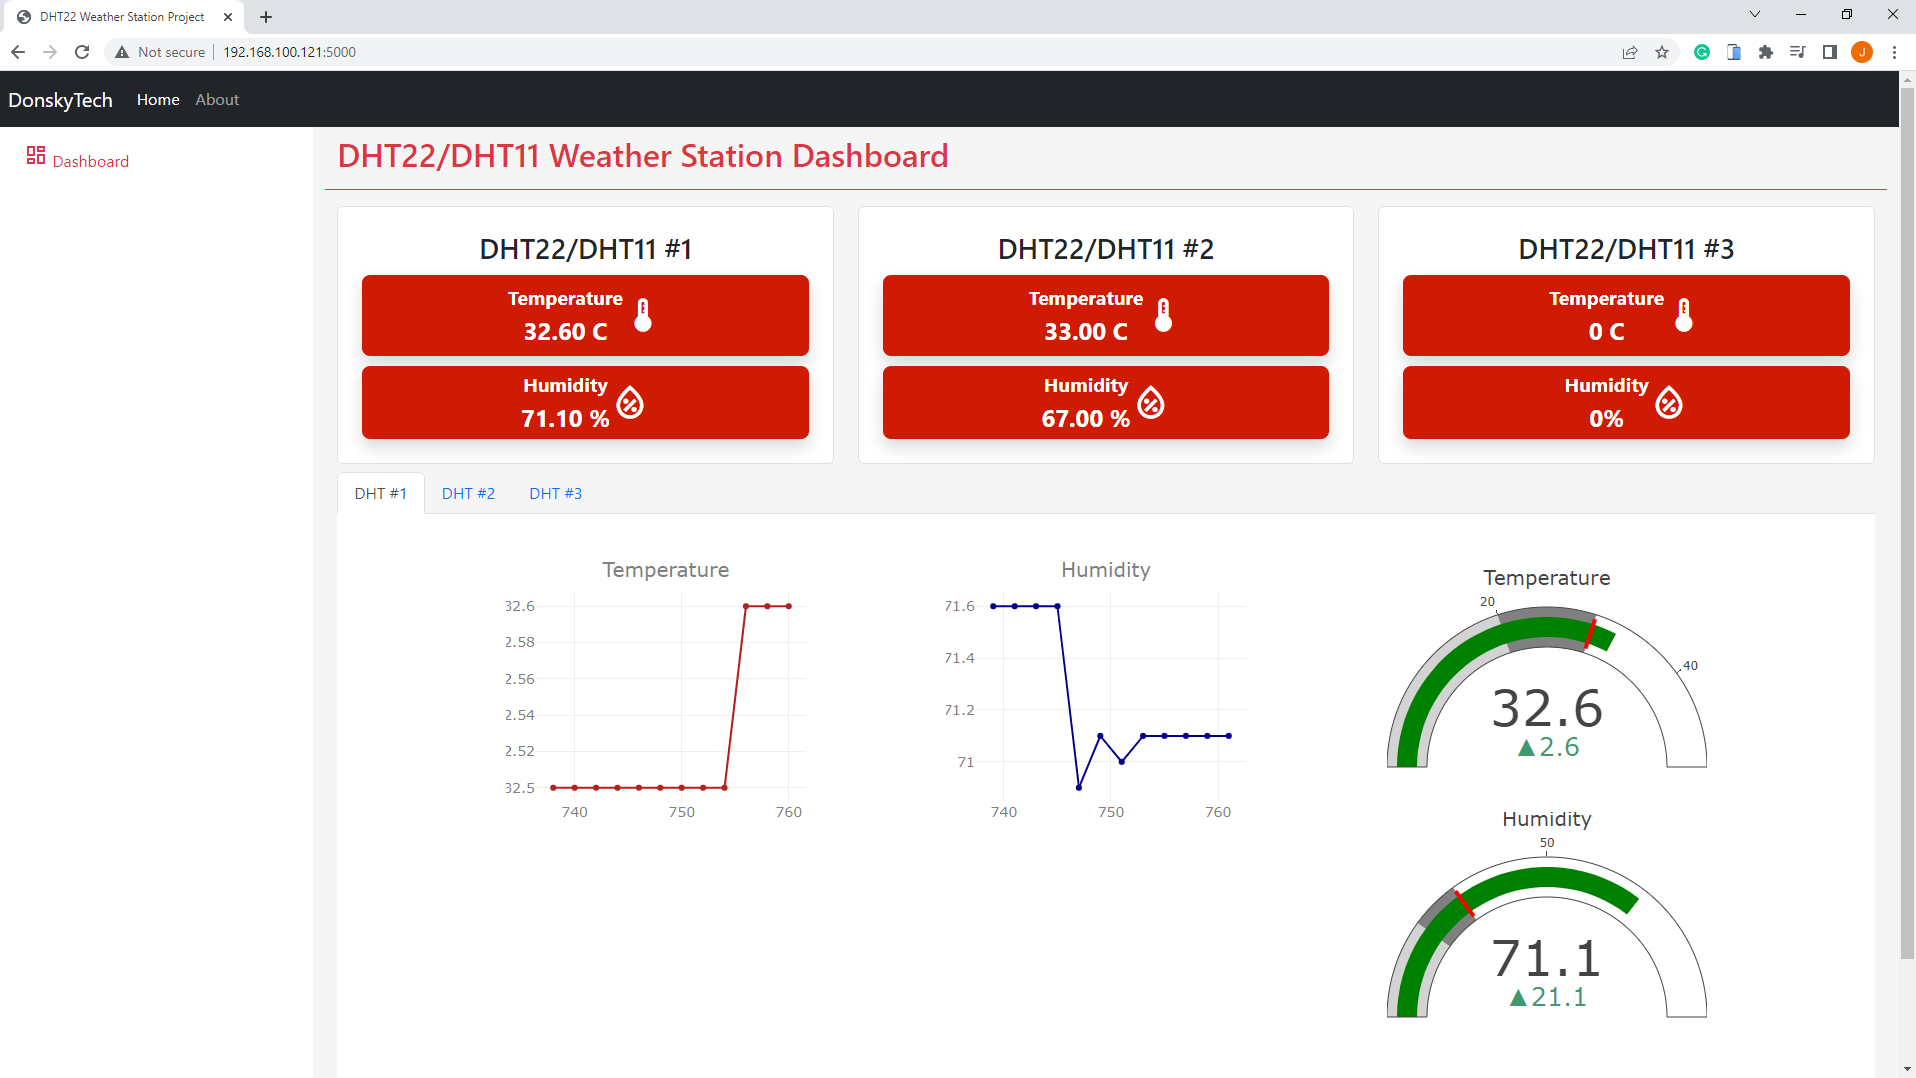
Raspberry Pi Weather Station (Multiple Sensors)
If you want a little bit more challenging then how about displaying multiple sensors all at the same time? I have got you covered as I have done the same.
Read Next:
Raspberry Pi IoT Weather Station
OpenCV QR Code Detection using your Web Browser
You can also utilize what we have discussed in this post for computer vision projects that uses OpenCV just like what I did in my QR Code security system where I used a web browser to display authentication result.
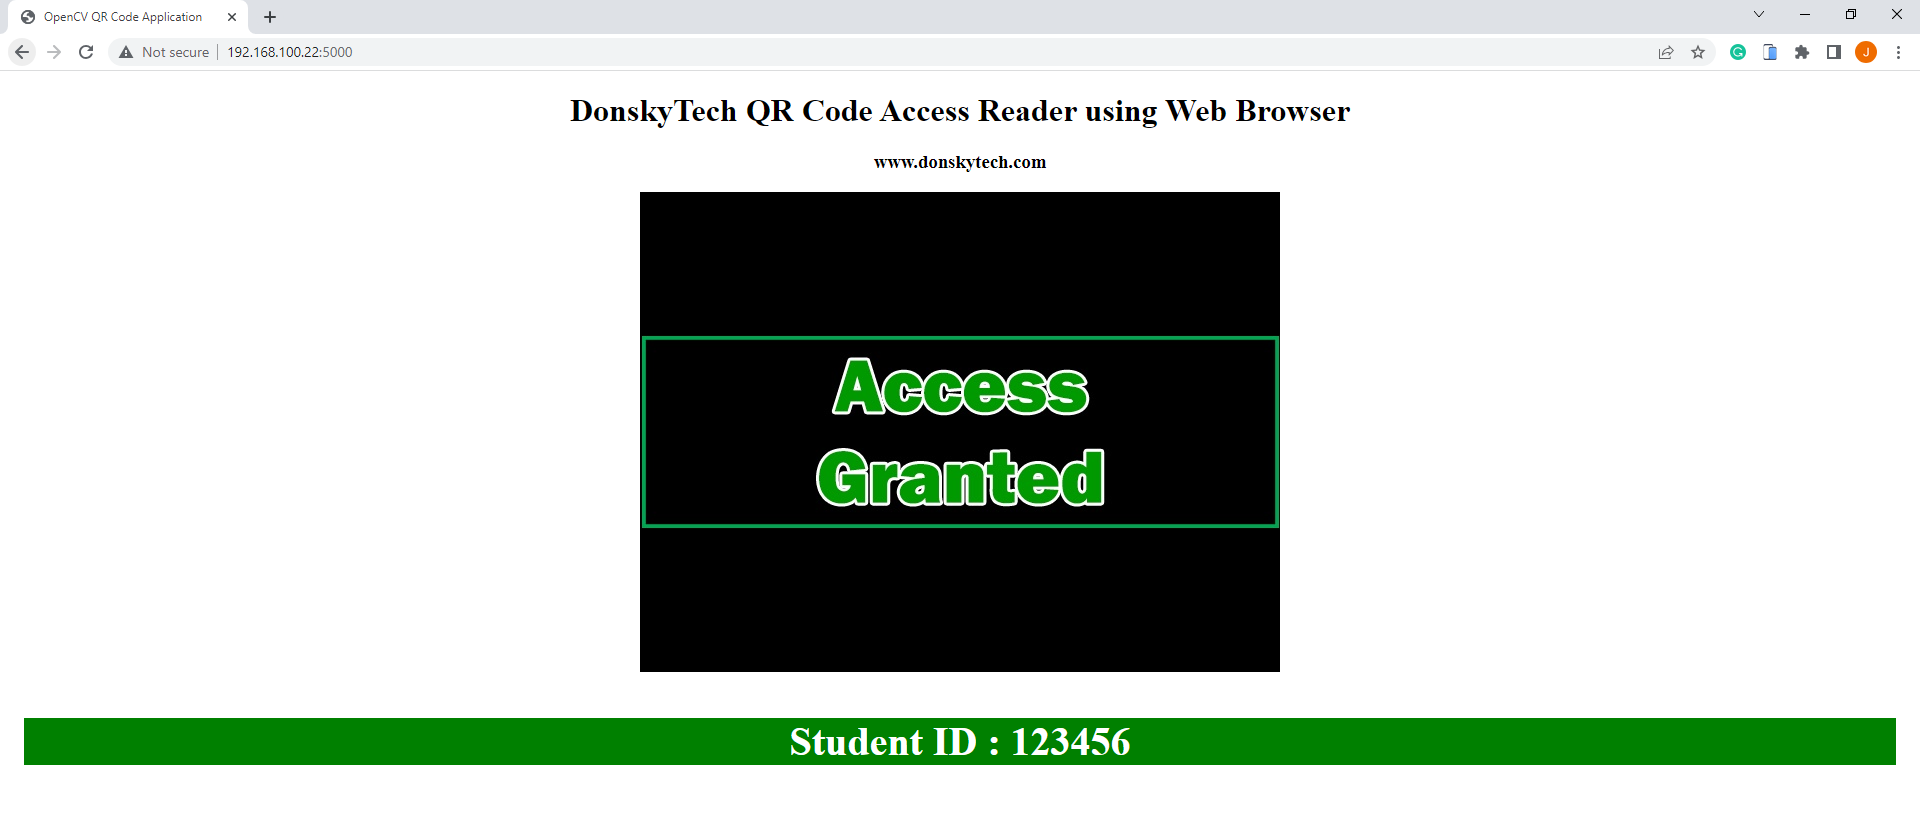
Read Next:
OpenCV QR Code Detection using your web browser
Wrap up
We were able to create a project that displays real-time data using Python, Flask, and WebSocket in this post. Using the Flask-SocketIO library to wrap our Websocket communication was easy as we have integrated it with an existing Flask application with not much overhead.
If any part of the code is not understandable to you then send me a comment here. I hope you have learned something.
Happy Exploring!
Leave a Reply