Introduction
I like creating a weather station project, especially with the power of the Raspberry Pi because you can even create your own mini Internet of Things (IoT) platform with it. On my last Raspberry Pi DHT22 Weather Station Project, I created an application that displays the real-time reading of my DHT22 sensors using Python, Flask, and Flask-SocketIO. Now we are going to expand it further by displaying multiple DHT22 sensor readings all at the same time.
If you want to see this project in an actual demo then please see the below video or watch it on my YouTube channel.
Raspberry Pi DHT22 Weather Station
Before you proceed to look at the code for this post, I highly suggest that you read thru the following two posts as they are mandatory for you to understand how this project will work.
Must Read:
Display Real-Time Updates Using Python, Flask, and WebSocket
Raspberry Pi DHT22 Weather Station Project
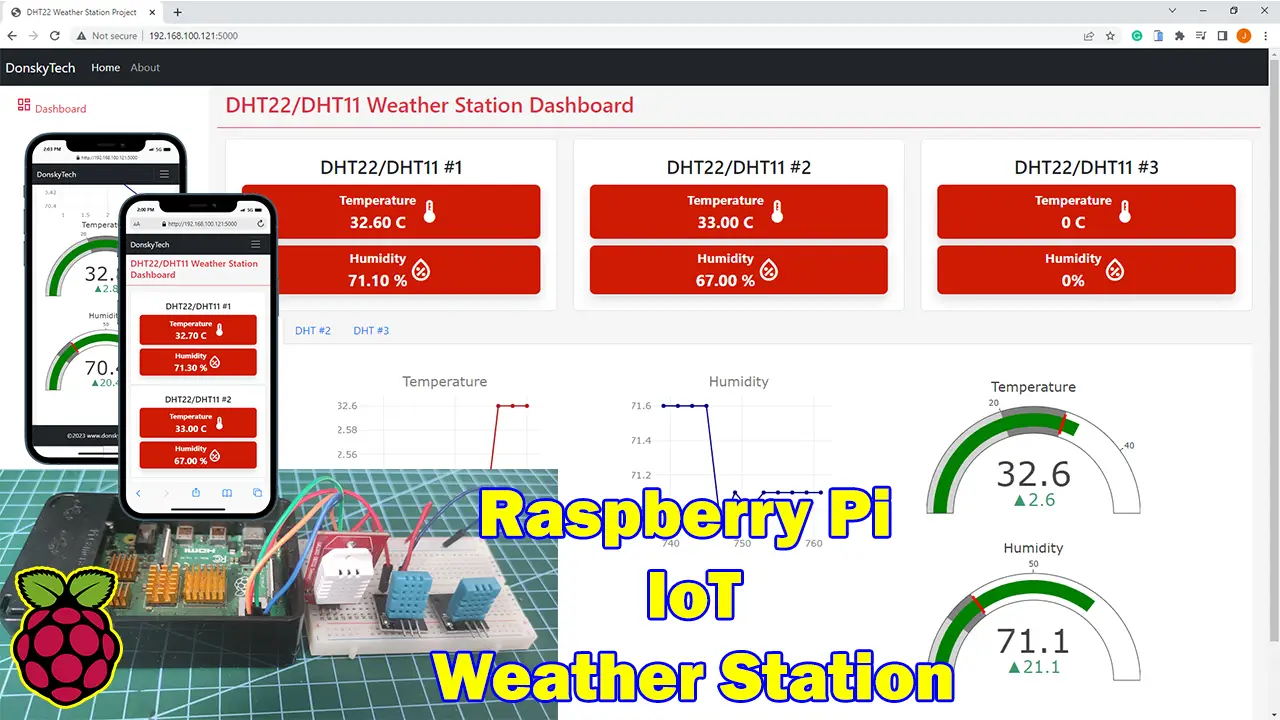
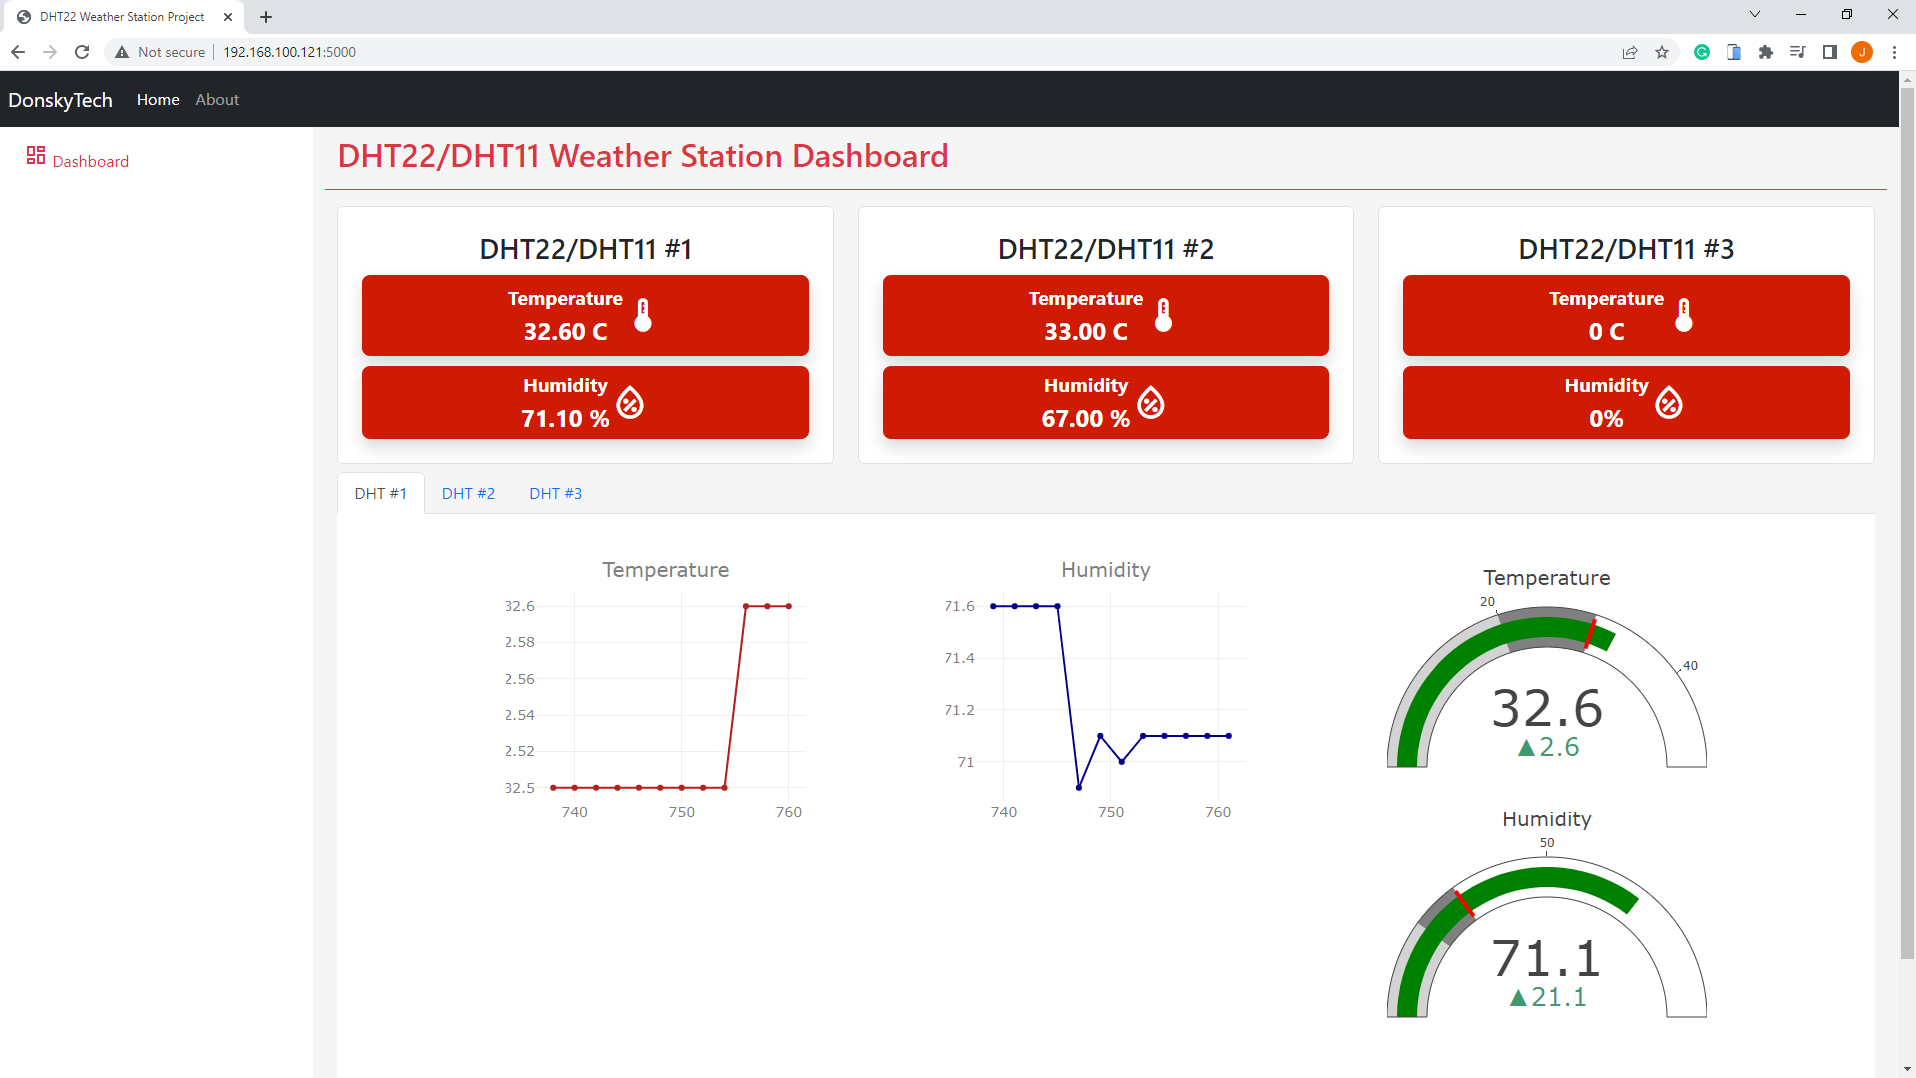
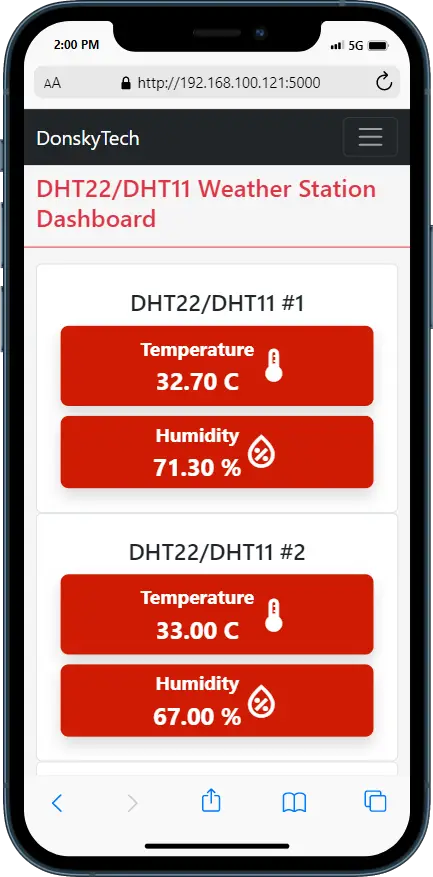
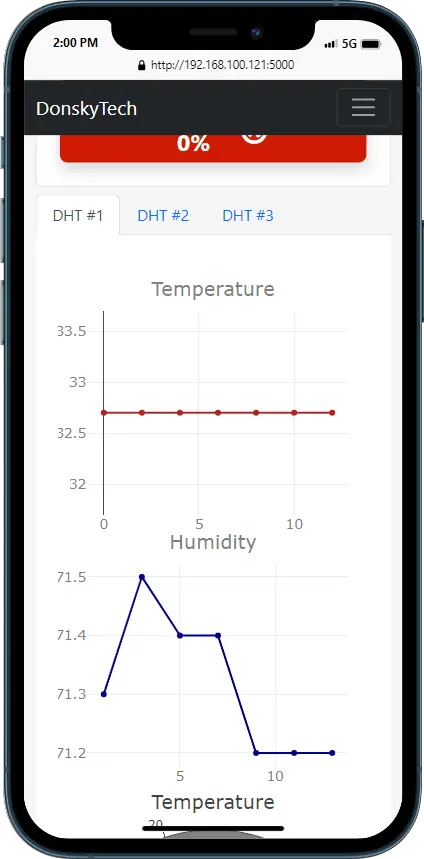
We will be using our Raspberry Pi as a hub that will display the real-time readings of several DHT22 sensors. We will be displaying both the temperature and humidity readings in both text and graphical chart format in a dashboard that I have created.
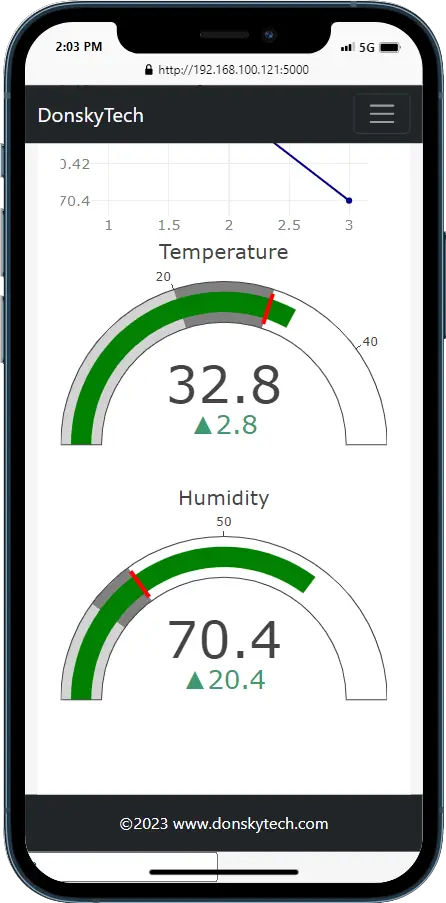
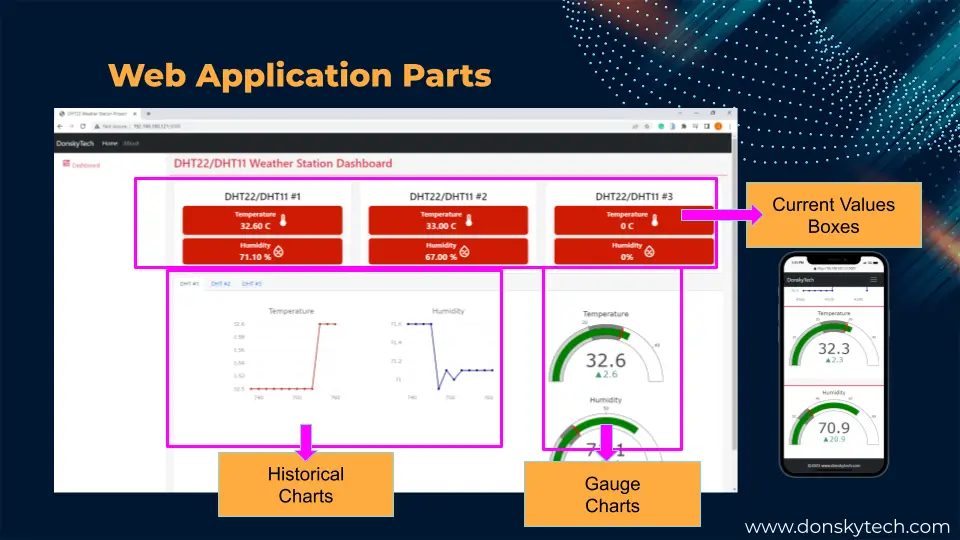
The below image is a sample dashboard of my Raspberry Pi Weather Station. The image is only showing 3 DHT22/DHT11 sensors but you can add more if you want and it would be displayed by my system.
Design
The same design from the previous post is applied here as we will still be using the below libraries in creating our Raspberry Pi weather station dashboard.
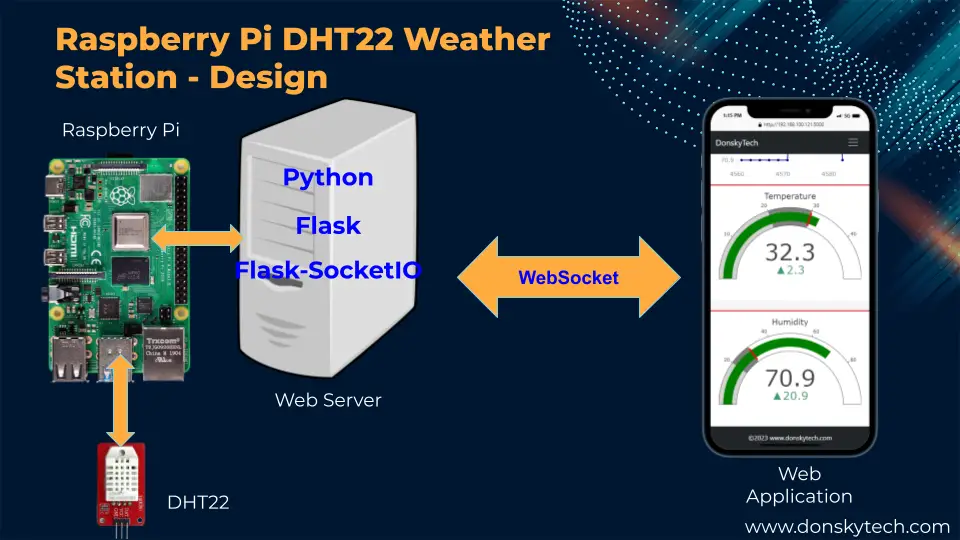
The image above will show you the overall design of our project. We are going to create a Web Server inside our Raspberry Pi that will serve our web application. At the same time, it would communicate with our DHT22 sensor to retrieve the latest sensor readings.
We are going to use the following tools/libraries in building the software side of this project.
We will be using Python in programming our backend web server application with our Raspberry Pi. In order to create our web application then we will be using the Flask microweb framework. The Flask-SocketIO is used to exchange messages between our web application and our DHT22 (AM2302) sensor. I have used the Bootstrap CSS framework in drawing the web application for this project.
I have used the Bootstrap HTML/CSS framework in developing the web application part of this project. We will make our web application responsive so that it looks good even on mobile devices. Using Bootstrap would help us not deal with the nitty-gritty details of developing web applications in HTML/CSS/Javascript. To get started with Bootstrap then please see this.
Prerequisites
As this is an IoT project so we need to have some knowledge of how to communicate with our DHT22 sensor from our web application. The following post will show you how we would communicate with our DHT22 sensor from our Raspberry Pi using Python, Flask, and Flask-SocketIO. I am using the adafruit-circuitpython-dht library in connecting with my DHT22 sensor in this post.
Must Read:
Raspberry Pi – How to Interface with a DHT22 sensor
Parts/Components
The followings are the parts/components needed to follow along with this post.
- Raspberry Pi 4B Model 8GB – Amazon | AliExpress
- or Raspberry Pi Zero 2 W – Amazon | AliExpress
- or Raspberry Pi Zero W – Amazon | AliExpress
- DHT22 (AM2302) – Amazon | AliExpress
- or DHT11 – Amazon | AliExpress | Bangood
- Breadboard – Amazon | AliExpress | Bangood
- Connecting Wires – Amazon | AliExpress | Bangood
Disclosure: These are affiliate links and I will earn small commissions to support my site when you buy through these links.
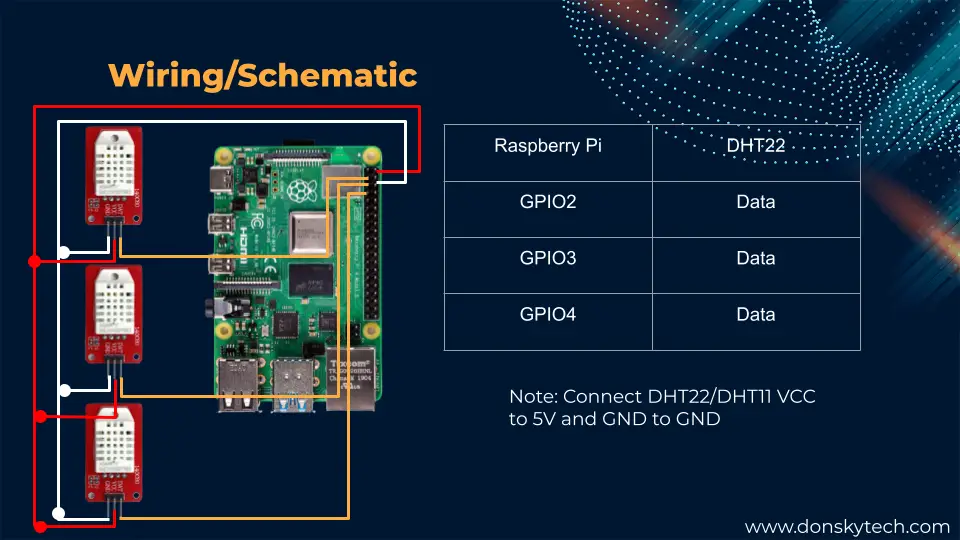
Wiring/Schematic
The below image shows the wiring and schematic for our Raspberry Pi DHT22 weather station project. I am using a Raspberry Pi 4B here but this project is also applicable to other variants such as Raspberry Pi Zero 2 W or Raspberry Pi Zero W.
Code
Setup
The code for our Raspberry Pi-powered DHT22 Weather Station Project is available on my GitHub repository and you can either download it as a zip file or clone it using Git.
Connect to your Raspberry Pi by using ssh or Putty and execute the below command to any available folder.
git clone https://github.com/donskytech/dht22-weather-station-python-flask-socketio-multiple-sensors.git
cd dht22-weather-station-python-flask-socketio-multiple-sensors
Create a new Python virtual environment on the same terminal.
# Windows or PC
py -m venv .venv
# Linux or Mac
python -m venv .venv
After the virtual environment is created then we can activate it by executing the below commands.
# Windows PC
.venv\Scripts\activate.bat
# Linux or Mac
source .venv/bin/activate
Install the required dependencies for this project.
pip install -r requirements.txtThe following are the required Python, Flask, and Flask-SocketIO dependencies needed to create our web application.
Adafruit-Blinka==8.19.0
adafruit-circuitpython-busdevice==5.2.5
adafruit-circuitpython-dht==4.0.1
adafruit-circuitpython-requests==1.13.3
adafruit-circuitpython-typing==1.9.3
Adafruit-PlatformDetect==3.46.0
Adafruit-PureIO==1.1.10
bidict==0.22.0
cachelib==0.9.0
click==8.1.3
dnspython==1.16.0
eventlet==0.30.2
Flask==2.2.1
Flask-Login==0.6.2
Flask-Session==0.4.0
Flask-SocketIO==5.3.4
greenlet==2.0.2
gunicorn==20.1.0
importlib-metadata==4.12.0
itsdangerous==2.1.2
Jinja2==3.1.2
MarkupSafe==2.1.1
pyftdi==0.54.0
pyserial==3.5
python-engineio==4.4.1
python-socketio==5.8.0
pyusb==1.2.1
rpi-ws281x==5.0.0
RPi.GPIO==0.7.1
six==1.11.0
sysv-ipc==1.1.0
typing-extensions==4.5.0
Werkzeug==2.2.3
zipp==3.8.1
Take note that it does not include the DHT22 libraries as this would need to be installed separately with the sudo requirement. Please see my earlier post on how to install this as it is mandatory so that we can retrieve our DHT22 sensor readings.
To run the project then you execute the following commands
flask run --host=0.0.0.0Access the web application by using the following URL in your web browser.
http://<IP-Address>:5000

# Sample Output
(.venv) pi@raspberrypi4:~/Projects/dht22-weather-station-python-flask-socketio $ flask run --host=0.0.0.0
WARNING: This is a development server. Do not use it in a production deployment. Use a production WSGI server instead.
 * Debug mode: off
WARNING: This is a development server. Do not use it in a production deployment. Use a production WSGI server instead.
 * Running on all addresses (0.0.0.0)
 * Running on http://127.0.0.1:5000
 * Running on http://192.168.100.121:5000
Press CTRL+C to quit
DHT22 Weather Station Project Files
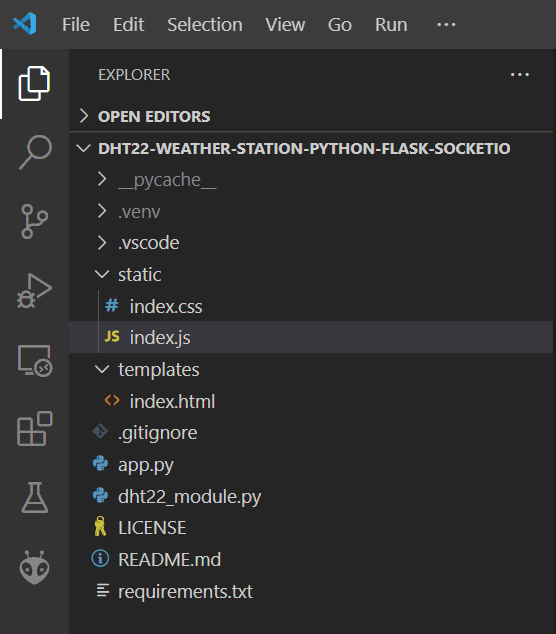
The image above shows the different parts of our Raspberry Pi DHT22 Weather Station project when you open it in Visual Studio Code and what are their roles.
- app.py – contains our Flask and Flask-SocketIO web server and our WebSocket server
- dht22_module.py – class that will read our DHT22 sensor
- templates/index.html – our web application that will display the current DHT22 sensor readings
- static/index.css – custom Cascading Stylesheet (CSS) to beautify our web page
- static/index.js – custom Javascript file that will open a WebSocket connection to our Flask-SocketIO server.
- requirements.txt – contains the libraries and dependencies for this project
Let us discuss what each file does one by one for us to understand how it works.
dht22_module.py
import adafruit_dht
import time


class DHT22Module:
    def __init__(self, id, pin, type=adafruit_dht.DHT22):
        self.id = id
        self.dht_device = type(pin)

    def get_id(self):
        return self.id

    def get_sensor_readings(self):
        # try reading the DHT sensor 2 times
        for _ in range(2):
            try:
                # Print the values to the serial port
                temperature_c = self.dht_device.temperature
                temperature_f = temperature_c * (9 / 5) + 32
                humidity = self.dht_device.humidity
                print(
                    "Temp: {:.1f} F / {:.1f} C    Humidity: {}% ".format(
                        temperature_f, temperature_c, humidity
                    )
                )
                return temperature_c, humidity

            except RuntimeError as error:
                # Errors happen fairly often, DHT's are hard to read, just keep going
                print(error.args[0])
                time.sleep(2.0)
                continue
            except Exception as error:
                self.dht_device.exit()
                raise error
The class DHT22Module is our main interface to our DHT22 sensor. In the constructor of the class, we passed in the unique ID of our sensor, the GPIO Pin, and the type of DHT which can either be an adafruit_dht.DHT22 or adafruit_dht.DHT11.
The function get_sensor_readings() is what we will call to retrieve the sensor readings from our DHT22 sensor. We are using the adafruit_dht library to retrieve the sensor readings and it would return a Python tuple of both the temperature and humidity readings.
app.py
import json
from flask import Flask, render_template, request
from flask_socketio import SocketIO
from threading import Lock
from dht22_module import DHT22Module
import board
import adafruit_dht

dht22_module_1 = DHT22Module(1, board.D2)
dht22_module_2 = DHT22Module(2, board.D3, adafruit_dht.DHT11)
dht22_module_3 = DHT22Module(3, board.D4)

dht_modules = [dht22_module_1, dht22_module_2, dht22_module_3]

thread = None
thread_lock = Lock()

app = Flask(__name__)
app.config["SECRET_KEY"] = "donsky!"
socketio = SocketIO(app, cors_allowed_origins="*")

"""
Background Thread
"""


def background_thread():
    while True:
        for dht in dht_modules:
            # Scan through all DHT sensor connected to our raspberry pi
            temperature, humidity = dht.get_sensor_readings() or (None, None)
            if temperature is not None or humidity is not None:
                sensor_readings = {
                    "id": dht.get_id(),
                    "temperature": temperature,
                    "humidity": humidity,
                }
                socketio.emit("updateSensorData", json.dumps(sensor_readings))
                socketio.sleep(1)


"""
Serve root index file
"""


@app.route("/")
def index():
    return render_template("index.html", dht_modules=dht_modules)


"""
Decorator for connect
"""


@socketio.on("connect")
def connect():
    global thread
    global thread_2
    global thread_3
    print("Client connected")

    with thread_lock:
        if thread is None:
            thread = socketio.start_background_task(background_thread)


"""
Decorator for disconnect
"""


@socketio.on("disconnect")
def disconnect():
    print("Client disconnected", request.sid)


if __name__ == "__main__":
    socketio.run(app, port=5000, host="0.0.0.0", debug=True)
The code above is our Python, Flask, and Flask-SocketIO program that will create a web server to display our web application and open a WebSocket server where we will send back the DHT22 sensor readings.
Let us go thru what each line of code does.
import json
from flask import Flask, render_template, request
from flask_socketio import SocketIO
from threading import Lock
from dht22_module import DHT22Module
import board
import adafruit_dht
We declare the needed Flask and FlaskSocket-IO libraries for us to create the web server and WebSocket application. Also, we import our class DHT22Module so that we could get our DHT22 sensor readings.
dht22_module_1 = DHT22Module(1, board.D2)
dht22_module_2 = DHT22Module(2, board.D3, adafruit_dht.DHT11)
dht22_module_3 = DHT22Module(3, board.D4)

dht_modules = [dht22_module_1, dht22_module_2, dht22_module_3]

thread = None
thread_lock = Lock()

app = Flask(__name__)
app.config["SECRET_KEY"] = "donsky!"
socketio = SocketIO(app, cors_allowed_origins="*")
We declare their instances of the class DHT22Module and assign it a unique ID and the GPIO pin assignment. I am using both DHT22 and DHT11 in my setup so you can set the required type for you. After which, we declare a list dht_modules of all the active DHT22/DHT11 sensors.
Next, we declare variables for our background thread and a class Lock() .
Lastly, we have initiated Flask and SocketIO classes that will serve as our web server and WebSocket.
def background_thread():
    while True:
        for dht in dht_modules:
            # Scan through all DHT sensor connected to our raspberry pi
            temperature, humidity = dht.get_sensor_readings() or (None, None)
            if temperature is not None or humidity is not None:
                sensor_readings = {
                    "id": dht.get_id(),
                    "temperature": temperature,
                    "humidity": humidity,
                }
                socketio.emit("updateSensorData", json.dumps(sensor_readings))
                socketio.sleep(1)
This is our background thread that will periodically read each of our DHT22 sensors on our list dht_modules. We then convert the sensor readings and convert it to JSON format before sending a WebSocket message to all WebSocket clients connected to our server.
Take note that we are using the event “updateSensorData” where we send our sensor readings in JSON format. This is important as the web application will listen to this particular event on the client side.
"""
Serve root index file
"""


@app.route("/")
def index():
    return render_template("index.html", dht_modules=dht_modules)
We define a flask route that will serve our index.html template that will show a dashboard page. This dashboard page will display all the sensor readings retrieved by our Raspberry Pi from our DHT22 sensor.
As you can see we are passing a parameter to display our list of DHT sensors. This list is important as we will be using it to display multiple DHT22/DHT11 sensors on our web application. Our index.html is a Jinja Template and we are going to use this list in drawing our web application later.
"""
Decorator for connect
"""


@socketio.on("connect")
def connect():
    global thread
    print("Client connected")

    with thread_lock:
        if thread is None:
            thread = socketio.start_background_task(background_thread)


"""
Decorator for disconnect
"""


@socketio.on("disconnect")
def disconnect():
    print("Client disconnected", request.sid)
When a WebSocket client connects to our WebSocket server then the background thread is initiated for that client. If it disconnects then it will just print that a client has disconnected.
The two functions connect() and disconnect() is decorated with Flask-SocketIO decorator functions.
templates/index.html
<!DOCTYPE html>
<html lang="en">
  <head>
    <meta charset="utf-8" />
    <meta name="viewport" content="width=device-width, initial-scale=1" />
    <title>DHT22 Weather Station Project</title>
    <link
      href="https://cdn.jsdelivr.net/npm/bootstrap@5.2.3/dist/css/bootstrap.min.css"
      rel="stylesheet"
      integrity="sha384-rbsA2VBKQhggwzxH7pPCaAqO46MgnOM80zW1RWuH61DGLwZJEdK2Kadq2F9CUG65"
      crossorigin="anonymous"
    />
    <link
      href="https://fonts.googleapis.com/css2?family=Material+Symbols+Outlined"
      rel="stylesheet"
    />
    <script
      src="https://cdn.plot.ly/plotly-2.20.0.min.js"
      charset="utf-8"
    ></script>
    <link href="../static/index.css" rel="stylesheet" />
    <script
      src="https://cdnjs.cloudflare.com/ajax/libs/socket.io/3.0.4/socket.io.js"
      integrity="sha512-aMGMvNYu8Ue4G+fHa359jcPb1u+ytAF+P2SCb+PxrjCdO3n3ZTxJ30zuH39rimUggmTwmh2u7wvQsDTHESnmfQ=="
      crossorigin="anonymous"
    ></script>
  </head>
  <body>
    <header>
      <!-- Fixed navbar -->
      <nav class="navbar navbar-expand-md navbar-dark fixed-top bg-dark">
        <div class="container-fluid">
          <a class="navbar-brand" href="#">DonskyTech</a>
          <button
            class="navbar-toggler"
            type="button"
            data-bs-toggle="collapse"
            data-bs-target="#navbarCollapse"
            aria-controls="navbarCollapse"
            aria-expanded="false"
            aria-label="Toggle navigation"
          >
            <span class="navbar-toggler-icon"></span>
          </button>
          <div class="collapse navbar-collapse" id="navbarCollapse">
            <ul class="navbar-nav me-auto mb-2 mb-md-0">
              <li class="nav-item">
                <a class="nav-link active" aria-current="page" href="#">Home</a>
              </li>
              <li class="nav-item">
                <a class="nav-link" href="#">About</a>
              </li>
            </ul>
          </div>
        </div>
      </nav>
    </header>
    <div class="container-fluid content mt-5">
      <div class="row">
        <nav
          id="sidebarMenu"
          class="col-md-3 col-lg-2 d-md-block sidebar collapse"
        >
          <div class="sidebar position-sticky pt-3 sidebar-sticky">
            <ul class="nav flex-column">
              <li class="nav-item">
                <a
                  class="nav-link active link-danger"
                  aria-current="page"
                  href="#"
                >
                  <span class="material-symbols-outlined"> dashboard </span>
                  Dashboard
                </a>
              </li>
            </ul>
          </div>
        </nav>
  <div class="col-md-9 ms-sm-auto col-lg-10 px-md-4">
          <div class="row">
            <div
              class="d-flex justify-content-between flex-wrap flex-md-nowrap align-items-center pt-3 pb-2 mb-3 border-bottom border-danger"
            >
              <h1 class="h2 text-danger">
                DHT22/DHT11 Weather Station Dashboard
              </h1>
            </div>
          </div>
          <div class="row">
            {%for dht in dht_modules%}

            <div class="col">
              <div
                class="readings align-items-center justify-content-center border rounded-2 p-4"
              >
                <h3>DHT22/DHT11 #{{dht.get_id()}}</h3>
                <div
                  class="box d-flex rounded-3 p-2 shadow align-items-center justify-content-center"
                >
                  <div class="right-side">
                    <div class="box-topic">Temperature</div>
                    <div class="number" id="temperature-{{dht.get_id()}}">
                      0 C
                    </div>
                  </div>
                  <span class="indicator material-symbols-outlined"
                    >device_thermostat</span
                  >
                </div>
                <div
                  class="box d-flex align-items-center justify-content-center rounded-3 p-1 shadow"
                >
                  <div class="right-side">
                    <div class="box-topic">Humidity</div>
                    <div class="number" id="humidity-{{dht.get_id()}}">0%</div>
                  </div>
                  <span class="indicator material-symbols-outlined">
                    humidity_percentage
                  </span>
                </div>
              </div>
            </div>
            {%endfor%}
</div>
<div class="row mt-2">
            <div class="col">
              <ul class="nav nav-tabs" id="myTab" role="tablist">
                {%for dht in dht_modules%}
                <li class="nav-item" role="presentation">
                  <button
                    class="nav-link {% if loop.index == 1 %}active{%endif%}"
                    id="dht-tab-{{dht.get_id()}}"
                    data-bs-toggle="tab"
                    data-bs-target="#dht-{{dht.get_id()}}"
                    data-tab-number="{{loop.index}}"
                    type="button"
                    role="tab"
                    aria-controls="dht-{{dht.get_id()}}"
                    aria-selected="true"
                  >
                    DHT #{{dht.get_id()}}
                  </button>
                </li>
                {%endfor%}
              </ul>
              <div class="tab-content">
                {%for dht in dht_modules%}

                <div
                  class="tab-pane {% if loop.index == 1 %}active{%endif%}"
                  id="dht-{{dht.get_id()}}"
                  role="tabpanel"
                  aria-labelledby="dht-tab-{{dht.get_id()}}"
                  tabindex="{{loop.index}}"
                >
                  <div
                    class="graphs d-flex flex-wrap bg-white justify-content-evenly p-5"
                  >
                    <div class="history-divs">
                      <div id="temperature-history-{{dht.get_id()}}"></div>
                    </div>
                    <div class="historical-charts">
                      <div class="history-divs">
                        <div id="humidity-history-{{dht.get_id()}}"></div>
                      </div>
                    </div>
                    <div class="d-flex flex-column gauge-charts">
                      <div class="">
                        <div id="temperature-gauge-{{dht.get_id()}}"></div>
                      </div>
                      <div class="">
                        <div id="humidity-gauge-{{dht.get_id()}}"></div>
                      </div>
                    </div>
                  </div>
                </div>
                {%endfor%}
              </div>
            </div>
          </div>
        </div>
      </div>
    </div>
<footer class="footer mt-auto py-3 bg-dark">
<div class="container text-center">
<span class="text-white">©2023 www.donskytech.com</span>
</div>
</footer>
<script
src="https://cdn.jsdelivr.net/npm/bootstrap@5.2.3/dist/js/bootstrap.bundle.min.js"
integrity="sha384-kenU1KFdBIe4zVF0s0G1M5b4hcpxyD9F7jL+jjXkk+Q2h455rYXK/7HAuoJl+0I4"
crossorigin="anonymous"
></script>
<script type="text/javascript" src="../static/index.js"></script>
<input
id="dhtCount"
type="text"
type="hidden"
value="{{'0' if dht_modules == None else dht_modules|length}}"
/>
</body>
</html>The following code above will represent our web application that will act as a dashboard page for our DHT22 sensor readings.
Below is how the HTML page is structured and the parts of the web applications. I have used Plotly.js in developing the graphical charts of this project. The top part is called boxes which display the current values.
For each DHT22/DHT11 sensor that you add to your system then I have created a tab for it so that we can display the historical charts and gauge much better.
The historical chart displays the last 12 readings while the gauge charts show the current values when compared to a range.
As mentioned above, I have used the Bootstrap HTML/CSS framework in developing this project so that it is mobile responsive. Let us try walking thru the code.
<!DOCTYPE html>
<html lang="en">
<head>
<meta charset="utf-8" />
<meta name="viewport" content="width=device-width, initial-scale=1" />
<title>DHT22 Weather Station Project</title>
<link
href="https://cdn.jsdelivr.net/npm/bootstrap@5.2.3/dist/css/bootstrap.min.css"
rel="stylesheet"
integrity="sha384-rbsA2VBKQhggwzxH7pPCaAqO46MgnOM80zW1RWuH61DGLwZJEdK2Kadq2F9CUG65"
crossorigin="anonymous"
/>
<link
href="https://fonts.googleapis.com/css2?family=Material+Symbols+Outlined"
rel="stylesheet"
/>
<script
src="https://cdn.plot.ly/plotly-2.20.0.min.js"
charset="utf-8"
></script>
<link href="../static/index.css" rel="stylesheet" />
<script
src="https://cdnjs.cloudflare.com/ajax/libs/socket.io/3.0.4/socket.io.js"
integrity="sha512-aMGMvNYu8Ue4G+fHa359jcPb1u+ytAF+P2SCb+PxrjCdO3n3ZTxJ30zuH39rimUggmTwmh2u7wvQsDTHESnmfQ=="
crossorigin="anonymous"
></script>
</head>The HEAD section is where we set the title and other meta elements for our Raspberry Pi DHT22 Weather Station Project. This is where we have imported several CSS and Javascript files like Bootstrap, Plotly, SocketIO, and custom project files.
<body>
<header>
<!-- Fixed navbar -->
<nav class="navbar navbar-expand-md navbar-dark fixed-top bg-dark">
<div class="container-fluid">
<a class="navbar-brand" href="#">DonskyTech</a>
<button
class="navbar-toggler"
type="button"
data-bs-toggle="collapse"
data-bs-target="#navbarCollapse"
aria-controls="navbarCollapse"
aria-expanded="false"
aria-label="Toggle navigation"
>
<span class="navbar-toggler-icon"></span>
</button>
<div class="collapse navbar-collapse" id="navbarCollapse">
<ul class="navbar-nav me-auto mb-2 mb-md-0">
<li class="nav-item">
<a class="nav-link active" aria-current="page" href="#">Home</a>
</li>
<li class="nav-item">
<a class="nav-link" href="#">About</a>
</li>
</ul>
</div>
</div>
</nav>
</header>The code above is what will show the header part of our web application and some of the visible menus at the top.
<div class="container-fluid content mt-5">
<div class="row">
<nav
id="sidebarMenu"
class="col-md-3 col-lg-2 d-md-block sidebar collapse"
>
<div class="sidebar position-sticky pt-3 sidebar-sticky">
<ul class="nav flex-column">
<li class="nav-item">
<a
class="nav-link active link-danger"
aria-current="page"
href="#"
>
<span class="material-symbols-outlined"> dashboard </span>
Dashboard
</a>
</li>
</ul>
</div>
</nav>This is the sidebar part of our web application. Currently, there is only one link which is the dashboard page.
<div class="col-md-9 ms-sm-auto col-lg-10 px-md-4">
<div class="row">
<div
class="d-flex justify-content-between flex-wrap flex-md-nowrap align-items-center pt-3 pb-2 mb-3 border-bottom border-danger"
>
<h1 class="h2 text-danger">
DHT22/DHT11 Weather Station Dashboard
</h1>
</div>
</div>
<div class="row">
{%for dht in dht_modules%}
<div class="col">
<div
class="readings align-items-center justify-content-center border rounded-2 p-4"
>
<h3>DHT22/DHT11 #{{dht.get_id()}}</h3>
<div
class="box d-flex rounded-3 p-2 shadow align-items-center justify-content-center"
>
<div class="right-side">
<div class="box-topic">Temperature</div>
<div class="number" id="temperature-{{dht.get_id()}}">
0 C
</div>
</div>
<span class="indicator material-symbols-outlined"
>device_thermostat</span
>
</div>
<div
class="box d-flex align-items-center justify-content-center rounded-3 p-1 shadow"
>
<div class="right-side">
<div class="box-topic">Humidity</div>
<div class="number" id="humidity-{{dht.get_id()}}">0%</div>
</div>
<span class="indicator material-symbols-outlined">
humidity_percentage
</span>
</div>
</div>
</div>
{%endfor%}To display the title and the boxes that show the humidity and temperature readings for each DHT sensor then we need the code above. As you can see, I am using the Jinja for looping expression here {%for dht in dht_modules%} to iterate for each sensor attach to our Raspberry Pi and display appropriate boxes for each.
<div class="row mt-2">
<div class="col">
<ul class="nav nav-tabs" id="myTab" role="tablist">
{%for dht in dht_modules%}
<li class="nav-item" role="presentation">
<button
class="nav-link {% if loop.index == 1 %}active{%endif%}"
id="dht-tab-{{dht.get_id()}}"
data-bs-toggle="tab"
data-bs-target="#dht-{{dht.get_id()}}"
data-tab-number="{{loop.index}}"
type="button"
role="tab"
aria-controls="dht-{{dht.get_id()}}"
aria-selected="true"
>
DHT #{{dht.get_id()}}
</button>
</li>
{%endfor%}
</ul>
<div class="tab-content">
{%for dht in dht_modules%}
<div
class="tab-pane {% if loop.index == 1 %}active{%endif%}"
id="dht-{{dht.get_id()}}"
role="tabpanel"
aria-labelledby="dht-tab-{{dht.get_id()}}"
tabindex="{{loop.index}}"
>
<div
class="graphs d-flex flex-wrap bg-white justify-content-evenly p-5"
>
<div class="history-divs">
<div id="temperature-history-{{dht.get_id()}}"></div>
</div>
<div class="historical-charts">
<div class="history-divs">
<div id="humidity-history-{{dht.get_id()}}"></div>
</div>
</div>
<div class="d-flex flex-column gauge-charts">
<div class="">
<div id="temperature-gauge-{{dht.get_id()}}"></div>
</div>
<div class="">
<div id="humidity-gauge-{{dht.get_id()}}"></div>
</div>
</div>
</div>
</div>
{%endfor%}
</div>
</div>
</div>
</div>
</div>
</div>This is the same also on how we are going to display the chart for DHT22/DHT11 sensor readings in a chart. To better show it to the user then we are using Bootstrap Tabs where each sensor has a dedicated tab to display its sensor readings.
We are using Plotly.js in developing these colorful charts and these HTML Div elements would be populated later by our javascript program.
<footer class="footer mt-auto py-3 bg-dark">
<div class="container text-center">
<span class="text-white">©2023 www.donskytech.com</span>
</div>
</footer>
<script
src="https://cdn.jsdelivr.net/npm/bootstrap@5.2.3/dist/js/bootstrap.bundle.min.js"
integrity="sha384-kenU1KFdBIe4zVF0s0G1M5b4hcpxyD9F7jL+jjXkk+Q2h455rYXK/7HAuoJl+0I4"
crossorigin="anonymous"
></script>
<script type="text/javascript" src="../static/index.js"></script>
<input
id="dhtCount"
type="text"
type="hidden"
value="{{'0' if dht_modules == None else dht_modules|length}}"
/>
</body>
</html>The footer section will just display my name which is donskytech and import our Bootstrap javascript and local index.js file.
To get the number of our sensors attached to our Raspberry Pi then I have created a hidden input with the id dhtCount which we will use on our Javascript program later.
static/index.js
// Temperature
let newTempXArray = [];
let newTempYArray = [];
// Humidity
let newHumidityXArray = [];
let newHumidityYArray = [];

// The maximum number of data points displayed on our scatter/line graph
let MAX_GRAPH_POINTS = 12;
let ctr = 0;

var currentTab = 1;
var numberOfDHTSensor = 3;
const TEMPERATURE_CHART_DIV = 0;
const HUMIDITY_CHART_DIV = 1;

window.addEventListener("load", (event) => {
  console.log("Page is ready!");
  numberOfDHTSensor = parseInt(document.querySelector("#dhtCount").value);
  drawCharts();
});

function drawCharts() {
  for (let index = 1; index <= numberOfDHTSensor; index++) {
    let temperatureHistoryDiv = document.getElementById(
      `temperature-history-${index}`
    );
    let humidityHistoryDiv = document.getElementById(
      `humidity-history-${index}`
    );
    let temperatureGaugeDiv = document.getElementById(
      `temperature-gauge-${index}`
    );
    let humidityGaugeDiv = document.getElementById(`humidity-gauge-${index}`);

    Plotly.newPlot(
      temperatureHistoryDiv,
      [temperatureTrace],
      temperatureLayout,
      graphConfig
    );
    Plotly.newPlot(
      humidityHistoryDiv,
      [humidityTrace],
      humidityLayout,
      graphConfig
    );

    Plotly.newPlot(temperatureGaugeDiv, temperatureData, layout, graphConfig);
    Plotly.newPlot(humidityGaugeDiv, humidityData, layout, graphConfig);
  }
}

function resetCharts() {
  for (let index = 1; index <= numberOfDHTSensor; index++) {
    let temperatureHistoryDiv = document.getElementById(
      `temperature-history-${index}`
    );
    let humidityHistoryDiv = document.getElementById(
      `humidity-history-${index}`
    );
    let temperatureGaugeDiv = document.getElementById(
      `temperature-gauge-${index}`
    );
    let humidityGaugeDiv = document.getElementById(`humidity-gauge-${index}`);

    let temp_data_update = {
      x: [newTempXArray],
      y: [newTempYArray],
    };
    let humidity_data_update = {
      x: [newHumidityXArray],
      y: [newHumidityYArray],
    };

    Plotly.update(temperatureHistoryDiv, temp_data_update);
    Plotly.update(humidityHistoryDiv, humidity_data_update);

    var temperature_gauge_update = {
      value: 0,
    };
    var humidity_gauge_update = {
      value: 0,
    };

    Plotly.update(temperatureGaugeDiv, temperature_gauge_update);
    Plotly.update(humidityGaugeDiv, humidity_gauge_update);
  }
}

// Initialize the tabs
tabLinks = document.querySelectorAll(".nav-link");

tabLinks.forEach(function (tab) {
  tab.addEventListener("click", function (e) {
    console.log(e.target.dataset.tabNumber);
    currentTab = parseInt(e.target.dataset.tabNumber);
    // Clear Temperature and Humidity Array
    newTempXArray = [];
    newTempYArray = [];
    newHumidityXArray = [];
    newHumidityYArray = [];

    resetCharts();
  });
});

var graphConfig = {
  displayModeBar: false,
  responsive: true,
};

// History Data
var temperatureTrace = {
  x: [],
  y: [],
  name: "Temperature",
  mode: "lines+markers",
  type: "line",
};
var humidityTrace = {
  x: [],
  y: [],
  name: "Humidity",
  mode: "lines+markers",
  type: "line",
};

var temperatureLayout = {
  autosize: false,
  title: {
    text: "Temperature",
  },
  font: {
    size: 14,
    color: "#7f7f7f",
  },
  colorway: ["#B22222"],
  width: 320,
  height: 260,
  margin: { t: 30, b: 20, l: 30, r: 20, pad: 0 },
};
var humidityLayout = {
  autosize: false,
  title: {
    text: "Humidity",
  },
  font: {
    size: 14,
    color: "#7f7f7f",
  },
  colorway: ["#00008B"],
  width: 320,
  height: 260,
  margin: { t: 30, b: 20, l: 30, r: 20, pad: 0 },
};
var config = { responsive: true };

// Gauge Data
var temperatureData = [
  {
    domain: { x: [0, 1], y: [0, 1] },
    value: 0,
    title: { text: "Temperature" },
    type: "indicator",
    mode: "gauge+number+delta",
    delta: { reference: 30 },
    gauge: {
      axis: { range: [null, 50] },
      steps: [
        { range: [0, 20], color: "lightgray" },
        { range: [20, 30], color: "gray" },
      ],
      threshold: {
        line: { color: "red", width: 4 },
        thickness: 0.75,
        value: 30,
      },
    },
  },
];

var humidityData = [
  {
    domain: { x: [0, 1], y: [0, 1] },
    value: 0,
    title: { text: "Humidity" },
    type: "indicator",
    mode: "gauge+number+delta",
    delta: { reference: 50 },
    gauge: {
      axis: { range: [null, 100] },
      steps: [
        { range: [0, 20], color: "lightgray" },
        { range: [20, 30], color: "gray" },
      ],
      threshold: {
        line: { color: "red", width: 4 },
        thickness: 0.75,
        value: 30,
      },
    },
  },
];

var layout = { width: 320, height: 250, margin: { t: 0, b: 0, l: 0, r: 0 } };

function updateBoxes(id, temperature, humidity) {
  let temperatureDiv = document.getElementById(`temperature-${id}`);
  let humidityDiv = document.getElementById(`humidity-${id}`);

  temperatureDiv.innerHTML = temperature + " C";
  humidityDiv.innerHTML = humidity + " %";
}

function updateGauge(id, temperature, humidity) {
  // If current tab is not equal to the websocket message id then we ignore
  if (currentTab !== id) return;
  var temperature_update = {
    value: temperature,
  };
  var humidity_update = {
    value: humidity,
  };
  let temperatureGaugeDiv = document.getElementById(`temperature-gauge-${id}`);
  let humidityGaugeDiv = document.getElementById(`humidity-gauge-${id}`);

  Plotly.update(temperatureGaugeDiv, temperature_update);
  Plotly.update(humidityGaugeDiv, humidity_update);
}

function updateCharts(id, lineChartDiv, xArray, yArray, sensorRead) {
  if (currentTab !== id) return;
  var today = new Date();
  // var time =
  //   today.getHours() + ":" + today.getMinutes() + ":" + today.getSeconds();
  if (xArray.length >= MAX_GRAPH_POINTS) {
    xArray.shift();
  }
  if (yArray.length >= MAX_GRAPH_POINTS) {
    yArray.shift();
  }
  xArray.push(ctr++);
  yArray.push(sensorRead);

  var data_update = {
    x: [xArray],
    y: [yArray],
  };

  if (lineChartDiv === TEMPERATURE_CHART_DIV) {
    let temperatureHistoryDiv = document.getElementById(
      `temperature-history-${id}`
    );
    Plotly.update(temperatureHistoryDiv, data_update);
  } else {
    let humidityHistoryDiv = document.getElementById(`humidity-history-${id}`);
    Plotly.update(humidityHistoryDiv, data_update);
  }
}

function updateSensorReadings(jsonResponse) {
  let id = jsonResponse.id;
  let temperature = jsonResponse.temperature.toFixed(2);
  let humidity = jsonResponse.humidity.toFixed(2);

  updateBoxes(id, temperature, humidity);

  updateGauge(id, temperature, humidity);

  // Update Temperature Line Chart
  updateCharts(
    id,
    TEMPERATURE_CHART_DIV,
    newTempXArray,
    newTempYArray,
    temperature
  );
  // Update Humidity Line Chart
  updateCharts(
    id,
    HUMIDITY_CHART_DIV,
    newHumidityXArray,
    newHumidityYArray,
    humidity
  );
}
/*
  SocketIO Code
*/
//   var socket = io.connect("http://" + document.domain + ":" + location.port);
var socket = io.connect();

//receive details from server
socket.on("updateSensorData", function (msg) {
  var sensorReadings = JSON.parse(msg);
  console.log(sensorReadings);
  updateSensorReadings(sensorReadings);
});
This file serves two main purposes. It draws our Plotly graphical charts and handles the WebSocket message exchange between the web application and our WebSocket server running on Flask-SocketIO.
// Temperature
let newTempXArray = [];
let newTempYArray = [];
// Humidity
let newHumidityXArray = [];
let newHumidityYArray = [];

// The maximum number of data points displayed on our scatter/line graph
let MAX_GRAPH_POINTS = 12;
let ctr = 0;

var currentTab = 1;
var numberOfDHTSensor = 3;
const TEMPERATURE_CHART_DIV = 0;
const HUMIDITY_CHART_DIV = 1;
We declare several variables that will handle our program data. The variables newTempXArray, newTempYArray, newHumidityXArray, and newHumidityYArray will hold the last 12 records of our sensor readings. We will use it on our graphical line chart later.
window.addEventListener("load", (event) => {
  console.log("Page is ready!");
  numberOfDHTSensor = parseInt(document.querySelector("#dhtCount").value);
  drawCharts();
});

function drawCharts() {
  for (let index = 1; index <= numberOfDHTSensor; index++) {
    let temperatureHistoryDiv = document.getElementById(
      `temperature-history-${index}`
    );
    let humidityHistoryDiv = document.getElementById(
      `humidity-history-${index}`
    );
    let temperatureGaugeDiv = document.getElementById(
      `temperature-gauge-${index}`
    );
    let humidityGaugeDiv = document.getElementById(`humidity-gauge-${index}`);

    Plotly.newPlot(
      temperatureHistoryDiv,
      [temperatureTrace],
      temperatureLayout,
      graphConfig
    );
    Plotly.newPlot(
      humidityHistoryDiv,
      [humidityTrace],
      humidityLayout,
      graphConfig
    );

    Plotly.newPlot(temperatureGaugeDiv, temperatureData, layout, graphConfig);
    Plotly.newPlot(humidityGaugeDiv, humidityData, layout, graphConfig);
  }
}
function resetCharts() {
  for (let index = 1; index <= numberOfDHTSensor; index++) {
    let temperatureHistoryDiv = document.getElementById(
      `temperature-history-${index}`
    );
    let humidityHistoryDiv = document.getElementById(
      `humidity-history-${index}`
    );
    let temperatureGaugeDiv = document.getElementById(
      `temperature-gauge-${index}`
    );
    let humidityGaugeDiv = document.getElementById(`humidity-gauge-${index}`);

    let temp_data_update = {
      x: [newTempXArray],
      y: [newTempYArray],
    };
    let humidity_data_update = {
      x: [newHumidityXArray],
      y: [newHumidityYArray],
    };

    Plotly.update(temperatureHistoryDiv, temp_data_update);
    Plotly.update(humidityHistoryDiv, humidity_data_update);

    var temperature_gauge_update = {
      value: 0,
    };
    var humidity_gauge_update = {
      value: 0,
    };

    Plotly.update(temperatureGaugeDiv, temperature_gauge_update);
    Plotly.update(humidityGaugeDiv, humidity_gauge_update);
  }
}
When our page finishes loading then we will extract the value of our hidden input to get the number of DHT22/DHT11 sensors that we will display. After which, we will draw our line charts by using the Plotly.js file.
The function resetCharts() will reinitialize our charts when we click each tab.
// Initialize the tabs
tabLinks = document.querySelectorAll(".nav-link");

tabLinks.forEach(function (tab) {
  tab.addEventListener("click", function (e) {
    console.log(e.target.dataset.tabNumber);
    currentTab = parseInt(e.target.dataset.tabNumber);
    // Clear Temperature and Humidity Array
    newTempXArray = [];
    newTempYArray = [];
    newHumidityXArray = [];
    newHumidityYArray = [];

    resetCharts();
  });
});
This is the code that will display our tabs and for each tab click then we will reset the array values so that we could draw the sensor reading of another DHT22/DHT11 sensor.
var graphConfig = {
  displayModeBar: false,
  responsive: true,
};

// History Data
var temperatureTrace = {
  x: [],
  y: [],
  name: "Temperature",
  mode: "lines+markers",
  type: "line",
};
var humidityTrace = {
  x: [],
  y: [],
  name: "Humidity",
  mode: "lines+markers",
  type: "line",
};

var temperatureLayout = {
  autosize: false,
  title: {
    text: "Temperature",
  },
  font: {
    size: 14,
    color: "#7f7f7f",
  },
  colorway: ["#B22222"],
  width: 320,
  height: 260,
  margin: { t: 30, b: 20, l: 30, r: 20, pad: 0 },
};
var humidityLayout = {
  autosize: false,
  title: {
    text: "Humidity",
  },
  font: {
    size: 14,
    color: "#7f7f7f",
  },
  colorway: ["#00008B"],
  width: 320,
  height: 260,
  margin: { t: 30, b: 20, l: 30, r: 20, pad: 0 },
};
var config = { responsive: true };

// Gauge Data
var temperatureData = [
  {
    domain: { x: [0, 1], y: [0, 1] },
    value: 0,
    title: { text: "Temperature" },
    type: "indicator",
    mode: "gauge+number+delta",
    delta: { reference: 30 },
    gauge: {
      axis: { range: [null, 50] },
      steps: [
        { range: [0, 20], color: "lightgray" },
        { range: [20, 30], color: "gray" },
      ],
      threshold: {
        line: { color: "red", width: 4 },
        thickness: 0.75,
        value: 30,
      },
    },
  },
];

var humidityData = [
  {
    domain: { x: [0, 1], y: [0, 1] },
    value: 0,
    title: { text: "Humidity" },
    type: "indicator",
    mode: "gauge+number+delta",
    delta: { reference: 50 },
    gauge: {
      axis: { range: [null, 100] },
      steps: [
        { range: [0, 20], color: "lightgray" },
        { range: [20, 30], color: "gray" },
      ],
      threshold: {
        line: { color: "red", width: 4 },
        thickness: 0.75,
        value: 30,
      },
    },
  },
];

var layout = { width: 320, height: 250, margin: { t: 0, b: 0, l: 0, r: 0 } };
The following variables are the configuration that we will need in order to draw our line and gauge charts.
function updateBoxes(id, temperature, humidity) {
  let temperatureDiv = document.getElementById(`temperature-${id}`);
  let humidityDiv = document.getElementById(`humidity-${id}`);

  temperatureDiv.innerHTML = temperature + " C";
  humidityDiv.innerHTML = humidity + " %";
}

function updateGauge(id, temperature, humidity) {
  // If current tab is not equal to the websocket message id then we ignore
  if (currentTab !== id) return;
  var temperature_update = {
    value: temperature,
  };
  var humidity_update = {
    value: humidity,
  };
  let temperatureGaugeDiv = document.getElementById(`temperature-gauge-${id}`);
  let humidityGaugeDiv = document.getElementById(`humidity-gauge-${id}`);

  Plotly.update(temperatureGaugeDiv, temperature_update);
  Plotly.update(humidityGaugeDiv, humidity_update);
}

function updateCharts(id, lineChartDiv, xArray, yArray, sensorRead) {
  if (currentTab !== id) return;
  var today = new Date();
  // var time =
  //   today.getHours() + ":" + today.getMinutes() + ":" + today.getSeconds();
  if (xArray.length >= MAX_GRAPH_POINTS) {
    xArray.shift();
  }
  if (yArray.length >= MAX_GRAPH_POINTS) {
    yArray.shift();
  }
  xArray.push(ctr++);
  yArray.push(sensorRead);

  var data_update = {
    x: [xArray],
    y: [yArray],
  };

  if (lineChartDiv === TEMPERATURE_CHART_DIV) {
    let temperatureHistoryDiv = document.getElementById(
      `temperature-history-${id}`
    );
    Plotly.update(temperatureHistoryDiv, data_update);
  } else {
    let humidityHistoryDiv = document.getElementById(`humidity-history-${id}`);
    Plotly.update(humidityHistoryDiv, data_update);
  }
}

function updateSensorReadings(jsonResponse) {
  let id = jsonResponse.id;
  let temperature = jsonResponse.temperature.toFixed(2);
  let humidity = jsonResponse.humidity.toFixed(2);

  updateBoxes(id, temperature, humidity);

  updateGauge(id, temperature, humidity);

  // Update Temperature Line Chart
  updateCharts(
    id,
    TEMPERATURE_CHART_DIV,
    newTempXArray,
    newTempYArray,
    temperature
  );
  // Update Humidity Line Chart
  updateCharts(
    id,
    HUMIDITY_CHART_DIV,
    newHumidityXArray,
    newHumidityYArray,
    humidity
  );
}
These are our utility functions that will update our user interface like the boxes, line, and gauge charts.
/*
  SocketIO Code
*/
//   var socket = io.connect("http://" + document.domain + ":" + location.port);
var socket = io.connect();

//receive details from server
socket.on("updateSensorData", function (msg) {
  var sensorReadings = JSON.parse(msg);
  console.log(sensorReadings);
  updateSensorReadings(sensorReadings);
});
These are our SocketIO code programming where we handle the WebSocket message exchange between our Flask web server plus the Flask-SocketIO WebSocket server and our web application.
We are listening to the event named updateSensorData and if a message comes into this event then we parse it and call the function updateSensorReadings(). This function would then call the different utility function that we created earlier that will update our web application.
static/index.css
body {
  background-color: #f5f5f5;
}
.bg-white {
  background-color: #fff;
}
.sidebar {
  background-color: #fff;
}

.readings {
  background-color: #fff;
  text-align: center;
  /* max-width: 250px; */
}

.box {
  background: #cf1b03;
  /* width: 100px; */
  color: #fff;
  margin-top: 10px;
  font-size: 1.2rem;
  font-weight: bold;
}
.box .indicator {
  font-size: 2.5rem;
}
.box .number {
  font-size: 1.5rem;
}
These are our custom CSS styling that will just add some little effects to our overall web application.
That is basically how the code works and how it contributes to our Raspberry Pi DHT22 Weather Station project.
How to add additional DHT22/DHT11 sensors?
To add more DHT22/DHT11 sensors for this project then you can edit your app.py and add your code like below.
dht22_module_1 = DHT22Module(1, board.D2)
dht22_module_2 = DHT22Module(2, board.D3, adafruit_dht.DHT11)
dht22_module_3 = DHT22Module(3, board.D4)
dht22_module_4 = DHT22Module(3, board.D17)
dht22_module_5 = DHT22Module(3, board.D27)
dht22_module_6 = DHT22Module(3, board.D22)
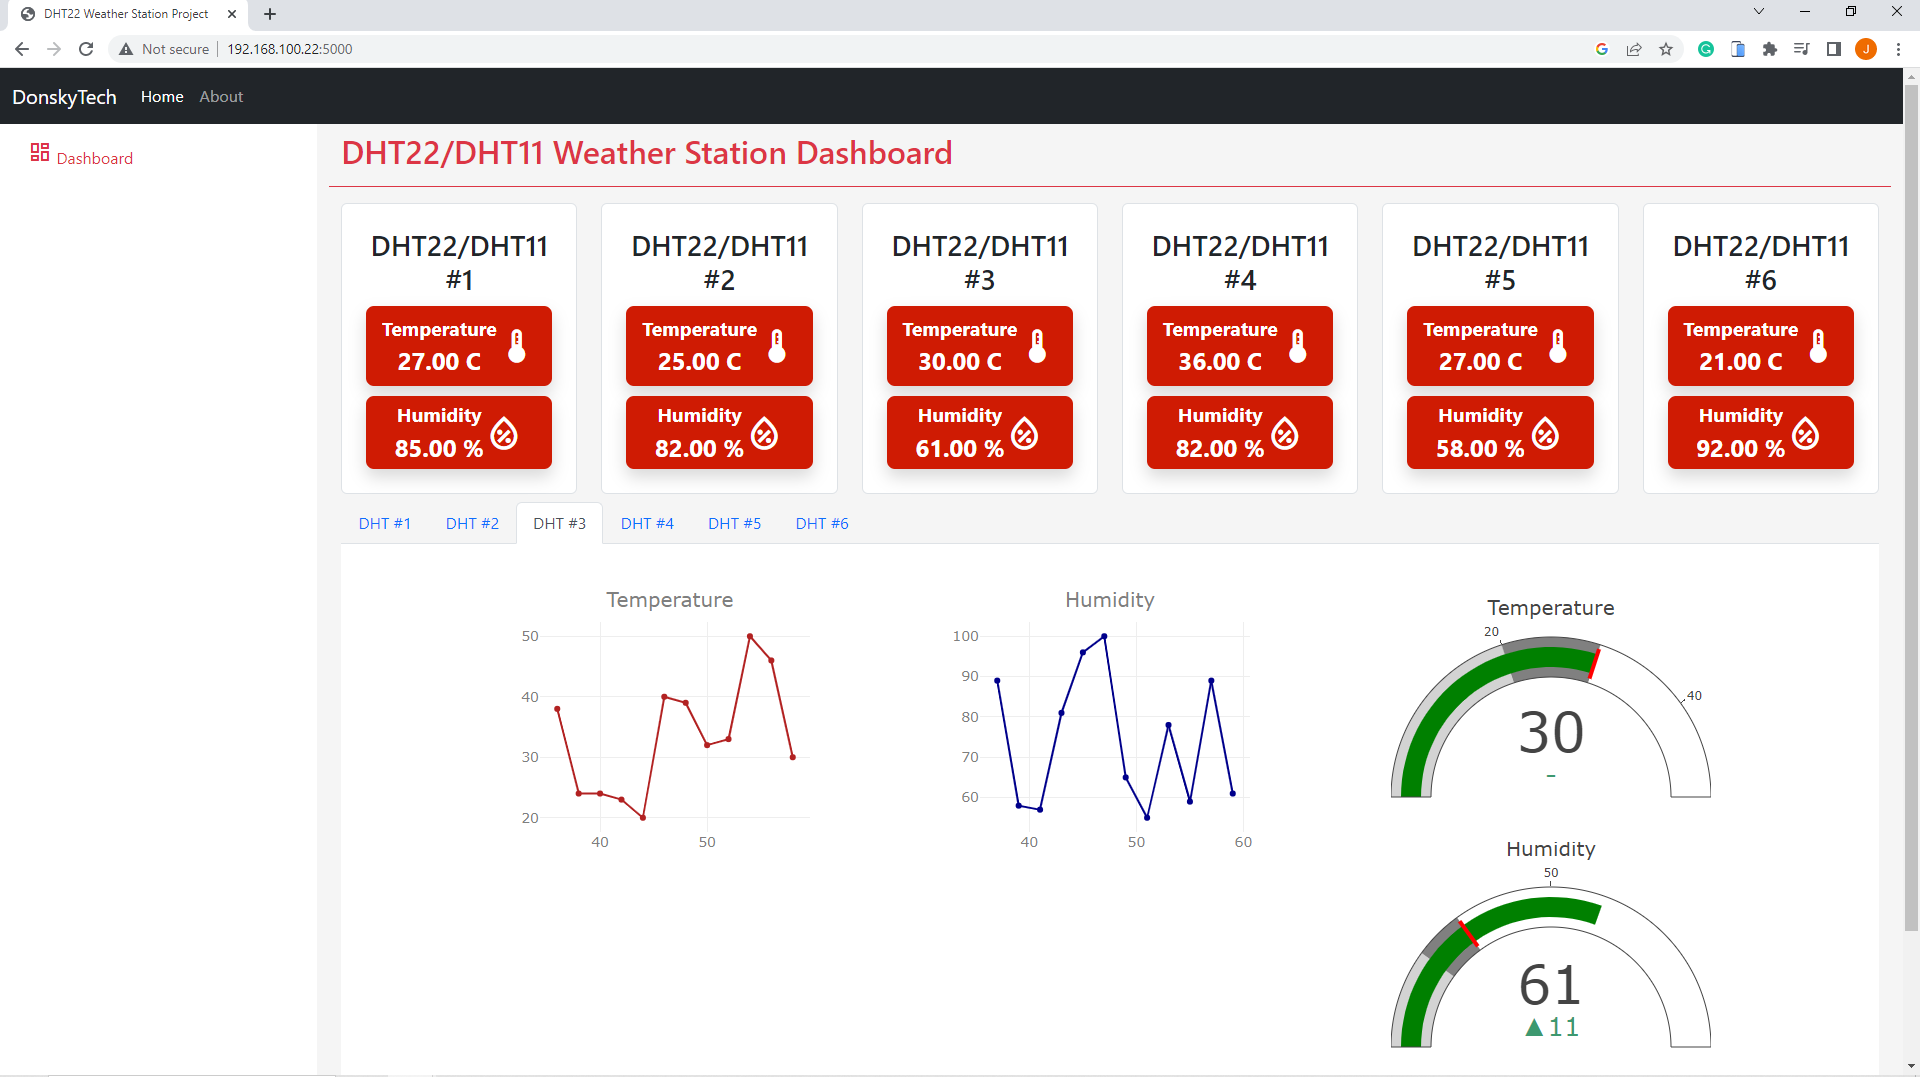
dht_modules = [dht22_module_1, dht22_module_2, dht22_module_3, dht22_module_4, dht22_module_5, dht22_module_6]This would result in the following user interface.
How to auto-start the Flask web application when your Raspberry Pi starts or boots?
If you wanted to automatically run this project when your Raspberry Pi starts or boots then please follow the steps outlined here.
Related Content:
Set up your Raspberry Pi to Start Python Script on Boot/Startup
Wrap Up
I have shown you how easy it is to create your own Raspberry Pi DHT22 Weather Station project using Python, Flask, and Flask-SocketIO. By leveraging the WebSocket feature of Flask-SocketIO then we were able to display the real-time sensor readings of our DHT22 sensor.
I hope you learned something. Happy exploring!
Leave a Reply