Introduction
Do you want to know how you could display real-time sensor readings on your Node-Red application with data coming from your Arduino board using WebSocket then this post is for you. We will explore how our Microcontroller running the Arduino framework is able to communicate with a WebSocket server running in Node-Red.
If you want to see a video demo presentation of this project then please see below or watch it on my YouTube channel.
What are we building?
We are displaying a real-time sensor reading of our Arduino-powered ESP32 Microcontroller using the Node-Red programming tool. We are not using any serial port connection here as they are running separately so we are using WebSocket in order for them to exchange messages.
Take note that the user interface that I am showing here is hand-coded by me and I am not using any of the user interface nodes or any library that comes with Node-Red.
Project Design
Supposed you have a sensor that is connected to one of your ESP32 microcontrollers running the Arduino framework and you wanted to monitor the sensor readings in real-time then you can use WebSocket in this case. Take note that the Arduino and its attached sensors could be placed in a different location from our Node-Red application and they could only communicate thru the network.
If you are not familiar with what WebSocket is then please read my post about it and how useful this protocol is.
Related Content:
Using WebSocket in the Internet of Things (IoT) projects
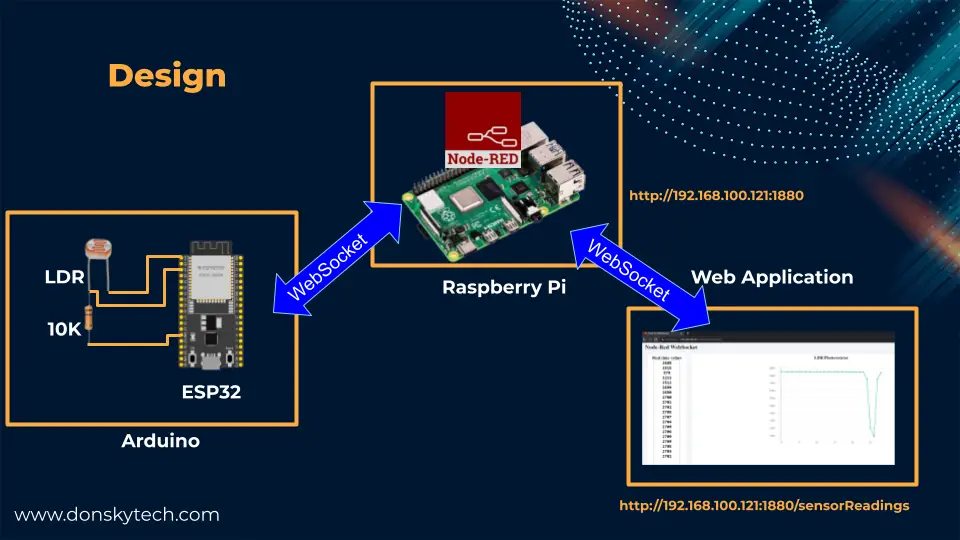
Our Node-Red with Arduino interface project will contain the following three major components:
- ESP32/LDR/Arduino – the source of our sensor readings.
- Raspberry Pi – the Node-Red WebSocket server
- Web Application – displays the user interface of our project. This is a custom web application running inside our Node-Red programming tool
All three components will communicate thru WebSocket as we are dealing with real-time data so this protocol is appropriate. We are going to create a flow inside our Node-Red application that will create the WebSocket server and the Web Application which would receive the sensor readings thru WebSocket.
Prerequisites
You should have a working Node-Red application where you can create your flow. I have installed Node-Red in my Raspberry Pi for this setup.
Related Content:
How to install Node-Red on Raspberry Pi
How to install Node-Red on Windows or PC
I am using an ESP32 Microcontroller board and have used the Arduino programming language in sending my sensor reading thru WebSocket. Also, you should be familiar with the PlatformIO IDE extension and if not then please read the below post.
Related Content:
PlatformIO Tutorial for Arduino Development
Parts/Components Required
The following are the components required to follow along with this post.
- Raspberry Pi 4B – Amazon | AliExpress
- ESP32 – Amazon | AliExpress | Bangood
- or ESP8266 – Amazon | AliExpress | Bangood
- LDR or PhotoResistor – Amazon | AliExpress
- Breadboard – Amazon | AliExpress | Bangood
- Connecting Wires – Amazon | AliExpress | Bangood
Disclosure: These are affiliate links and I will earn small commissions to support my site when you buy through these links.
Wiring/Schematic
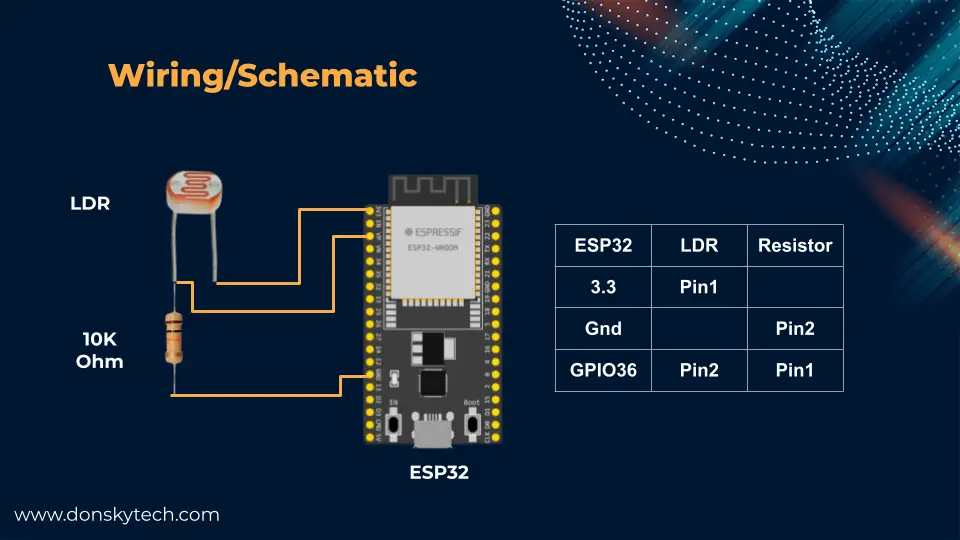
The wiring and schematic for this project are shown above. I have chosen an LDR or Photoresistor for my sensor here as it changes its value instantaneously. But you can choose another sensor if you like.
Related Content:
Read LDR/Photoresistor Sensor using ESP32
Interfacing Photoresistor or LDR into NodeMCU ESP8266
Code
The code for this project is available in my GitHub repositories. As there are two different projects involved so we will discuss them separately.
Arduino – Send sensor readings
The Arduino code that will send the sensor readings is available thru my GitHub repository and you can either download it as a zip file or clone it using below Git command.
git clone https://github.com/donskytech/platformio-projects.git
cd esp32-projects/esp32-send-sensor-websocket
Open the following project in Visual Studio Code.
How do we send WebSocket messages from Arduino?
We will use the following ArduinoWebSockets library in order for us to send WebSocket messages to our Node-Red WebSocket server. I have installed this library as a library dependency on our platform.ini file.
[env:esp32dev]
platform = espressif32
board = esp32dev
framework = arduino
; Serial Monitor options
monitor_speed = 115200
lib_deps =
    https://github.com/Links2004/arduinoWebSockets.git
The main.cpp code shown below is where we read our LDR or Photoresistor and sends the reading to our Node-Red WebSocket server. Let us walk thru what each line of the code does.
#include <Arduino.h>
#ifdef ESP32
#include <WiFi.h>
#elif defined(ESP8266)
#include <ESP8266WiFi.h>
#endif

#include <WebSocketsClient.h>

int sensorVal;
const int ANALOG_READ_PIN = 36; // or A0
const int RESOLUTION = 12;      // Could be 9-12

// Enter your User ID and Password for your wifi connection
const char *SSID = "<YOUR_WIFI_SSID>";
const char *PASSWORD = "<YOUR_WIFI_PASSWORD>";

WebSocketsClient webSocket;

void setup()
{
  Serial.begin(115200);
  Serial.println("Connecting to ");
  Serial.println(SSID);
  WiFi.mode(WIFI_STA);
  WiFi.begin(SSID, PASSWORD);
  if (WiFi.waitForConnectResult() != WL_CONNECTED)
  {
    Serial.printf("WiFi Failed!\n");
    return;
  }

  Serial.print("IP Address: ");
  Serial.println(WiFi.localIP());

  // server address, port and URL - ws://192.168.100.121:1880/ws/readings
  webSocket.begin("192.168.100.121", 1880, "/ws/readings");

  // try ever 5000 again if connection has failed
  webSocket.setReconnectInterval(5000);

  delay(1000);
}
unsigned long previousMillis = 0;
const int interval = 1000;

void loop()
{
  analogReadResolution(RESOLUTION);
  // Read and print the sensor pin value
  sensorVal = analogRead(ANALOG_READ_PIN);
  // Serial.print(sensorVal);
  // Serial.print(" \n");

  webSocket.loop();

  unsigned long currentMillis = millis();

  if (currentMillis - previousMillis >= interval)
  {
    // save the last time we send the last reading
    previousMillis = currentMillis;

    char buffer[5];
    sprintf(buffer, "%d", sensorVal);
    // send sensor readings thru WebSocket
    webSocket.sendTXT(buffer);
  }
}
#include <Arduino.h>
#ifdef ESP32
#include <WiFi.h>
#elif defined(ESP8266)
#include <ESP8266WiFi.h>
#endif
#include <WebSocketsClient.h>Import the WiFi library for our ESP32/ESP8266 microcontroller. Also, include the WebSocket client from our ArduinoWebSockets library.
int sensorVal;
const int ANALOG_READ_PIN = 36; // or A0
const int RESOLUTION = 12;      // Could be 9-12

// Enter your User ID and Password for your wifi connection
const char *SSID = "<YOUR_WIFI_SSID>";
const char *PASSWORD = "<YOUR_WIFI_PASSWORD>";

WebSocketsClient webSocket;
We define the GPIO pin where the LDR or PhotoResistor is attached. Replace the SSID and PASSWORD variables to match your WiFi network configuration. Lastly, we define a WebSocketsClient object that we will use to send WebSocket messages.
void setup()
{
  Serial.begin(115200);
  Serial.println("Connecting to ");
  Serial.println(SSID);
  WiFi.mode(WIFI_STA);
  WiFi.begin(SSID, PASSWORD);
  if (WiFi.waitForConnectResult() != WL_CONNECTED)
  {
    Serial.printf("WiFi Failed!\n");
    return;
  }

  Serial.print("IP Address: ");
  Serial.println(WiFi.localIP());

  // server address, port and URL - ws://192.168.100.121:1880/ws/readings
  webSocket.begin("192.168.100.121", 1880, "/ws/readings");

  // try ever 5000 again if connection has failed
  webSocket.setReconnectInterval(5000);

  delay(1000);
}
The setup() function contains our initialization code and it does the following:
- set the baud rate for our serial monitor
- connect to our WiFi network
- begin the connection to our WebSocket server
- Set up the reconnect interval just in case the WebSocket connection gets dropped.
unsigned long previousMillis = 0;
const int interval = 1000;

void loop()
{
  analogReadResolution(RESOLUTION);
  // Read and print the sensor pin value
  sensorVal = analogRead(ANALOG_READ_PIN);
  // Serial.print(sensorVal);
  // Serial.print(" \n");

  webSocket.loop();

  unsigned long currentMillis = millis();

  if (currentMillis - previousMillis >= interval)
  {
    // save the last time we send the last reading
    previousMillis = currentMillis;

    char buffer[5];
    sprintf(buffer, "%d", sensorVal);
    // send sensor readings thru WebSocket
    webSocket.sendTXT(buffer);
  }
}
Define the interval for our sending the LDR sensor read. Next, we read the readings of our LDR or Photoresistor. The webSocket.loop() is used to listen to WebSocket messages from our Node-Red server.
When the interval is exceeded then we send the readings thru the webSocket.sendTXT(buffer) and that is all for the Arduino code that will send the sensor readings thru WebSocket.
Node-Red WebSocket Server
The code for the Node-Red WebSocket server flow is shown below and is available also on my GitHub repository.
[{"id":"3de7f87250c169e2","type":"websocket in","z":"b93e9b260d53649d","name":"","server":"8dbef215b4efa8a7","client":"","x":400,"y":600,"wires":[["ce592e4dc2db096b"]]},{"id":"2a88ff5bce73144b","type":"debug","z":"b93e9b260d53649d","name":"debug 5","active":false,"tosidebar":true,"console":false,"tostatus":false,"complete":"true","targetType":"full","statusVal":"","statusType":"auto","x":920,"y":680,"wires":[]},{"id":"2d0866385f48fa75","type":"http in","z":"b93e9b260d53649d","name":"","url":"/sensorReadings","method":"get","upload":false,"swaggerDoc":"","x":380,"y":240,"wires":[["f14f34c54fcfaed0"]]},{"id":"3f31af6081e79e4b","type":"inject","z":"b93e9b260d53649d","name":"","props":[{"p":"payload"},{"p":"topic","vt":"str"}],"repeat":"","crontab":"","once":false,"onceDelay":0.1,"topic":"","payload":"","payloadType":"date","x":500,"y":500,"wires":[["ad3e1c6852897a8a"]]},{"id":"ad3e1c6852897a8a","type":"websocket out","z":"b93e9b260d53649d","name":"","server":"8dbef215b4efa8a7","client":"","x":930,"y":500,"wires":[]},{"id":"ce592e4dc2db096b","type":"function","z":"b93e9b260d53649d","name":"Clear Session","func":"msg._session = \"\";\nreturn msg;","outputs":1,"noerr":0,"initialize":"","finalize":"","libs":[],"x":680,"y":600,"wires":[["2a88ff5bce73144b","ad3e1c6852897a8a"]]},{"id":"f14f34c54fcfaed0","type":"template","z":"b93e9b260d53649d","name":"Javascript","field":"payload.script","fieldType":"msg","format":"handlebars","syntax":"mustache","template":"const sensorValues = document.querySelector(\"#sensor-values\");\n\nconst sensorData = [];\n\n/*\n Plotly.js graph and chart setup code\n*/\nvar sensorChartDiv = document.getElementById(\"sensor-chart\");\n\n// History Data\nvar sensorTrace = {\n x: [],\n y: [],\n name: \"LDR/Photoresistor\",\n mode: \"lines+markers\",\n type: \"line\",\n};\n\nvar sensorLayout = {\n autosize: false,\n width: 800,\n height: 500,\n colorway: [\"#05AD86\"],\n margin: { t: 40, b: 40, l: 80, r: 80, pad: 0 },\n xaxis: {\n gridwidth: \"2\",\n autorange: true,\n },\n yaxis: {\n gridwidth: \"2\",\n autorange: true,\n },\n};\nvar config = { responsive: true };\n\nPlotly.newPlot(sensorChartDiv, [sensorTrace], sensorLayout, config);\n\n// Will hold the sensor reads\nlet newSensorXArray = [];\nlet newSensorYArray = [];\n\n// The maximum number of data points displayed on our scatter/line graph\nlet MAX_GRAPH_POINTS = 50;\nlet ctr = 0;\n\nfunction updateChart(sensorRead) {\n if (newSensorXArray.length >= MAX_GRAPH_POINTS) {\n newSensorXArray.shift();\n }\n if (newSensorYArray.length >= MAX_GRAPH_POINTS) {\n newSensorYArray.shift();\n }\n newSensorXArray.push(ctr++);\n newSensorYArray.push(sensorRead);\n\n var data_update = {\n x: [newSensorXArray],\n y: [newSensorYArray],\n };\n\n Plotly.update(sensorChartDiv, data_update);\n}\n\n// WebSocket support\nvar targetUrl = `ws://${location.host}/ws/readings`;\nvar websocket;\nwindow.addEventListener(\"load\", onLoad);\n\nfunction onLoad() {\n initializeSocket();\n}\n\nfunction initializeSocket() {\n console.log(\"Opening WebSocket connection Node-Red Server...\");\n websocket = new WebSocket(targetUrl);\n websocket.onopen = onOpen;\n websocket.onclose = onClose;\n websocket.onmessage = onMessage;\n}\nfunction onOpen(event) {\n console.log(\"Starting connection to WebSocket server..\");\n}\nfunction onClose(event) {\n console.log(\"Closing connection to server..\");\n setTimeout(initializeSocket, 2000);\n}\nfunction onMessage(event) {\n console.log(\"WebSocket message received:\", event);\n updateValues(event.data);\n updateChart(event.data);\n}\n\nfunction sendMessage(message) {\n websocket.send(message);\n}\n\nfunction updateValues(data) {\n sensorData.unshift(data);\n if (sensorData.length > 20) sensorData.pop();\n sensorValues.value = sensorData.join(\"\\r\\n\");\n}\n","output":"str","x":580,"y":340,"wires":[["ce0f6f510b40daa3"]]},{"id":"ce0f6f510b40daa3","type":"template","z":"b93e9b260d53649d","name":"CSS","field":"payload.style","fieldType":"msg","format":"handlebars","syntax":"mustache","template":":root {\n --color-white: #fff;\n --color-dark-variant: #f3f5f8;\n --border-radius-1: 0.4rem;\n}\n\n* {\n margin: 0;\n padding: 0;\n outline: 0;\n}\n\nbody {\n width: 100vw;\n height: 100vh;\n overflow-x: hidden;\n background: var(--color-dark-variant);\n}\nh1 {\n margin-top: 0.4rem;\n margin-left: 1.6rem;\n}\n\n.container {\n display: grid;\n width: 96%;\n margin: 0 auto;\n gap: 1.8rem;\n grid-template-columns: 14rem auto;\n}\naside {\n margin-top: 1.4rem;\n height: 100vh;\n background: var(--color-white);\n border-radius: var(--border-radius-1);\n padding: 0.4rem;\n display: flex;\n flex-direction: column;\n align-items: center;\n justify-content: center;\n}\n.values {\n text-align: center;\n resize: none;\n height: 100%;\n font-size: 1.5rem;\n font-weight: bold;\n}\n\nmain {\n margin-top: 1.4rem;\n background: var(--color-white);\n padding: 0.4rem;\n /* border: 1px solid red; */\n text-align: center;\n}\n\n.wrapper {\n display: flex;\n align-items: center;\n justify-content: center;\n}\n","output":"str","x":730,"y":240,"wires":[["0f0def2d6e7cb078"]]},{"id":"0f0def2d6e7cb078","type":"template","z":"b93e9b260d53649d","name":"HTML","field":"payload","fieldType":"msg","format":"handlebars","syntax":"mustache","template":"<!DOCTYPE html>\n<html lang=\"en\">\n <head>\n <meta charset=\"UTF-8\" />\n <meta name=\"viewport\" content=\"width=device-width, initial-scale=1.0\" />\n <meta http-equiv=\"X-UA-Compatible\" content=\"ie=edge\" />\n <title>Node-Red WebSocket</title>\n <style>{{{payload.style}}}</style>\n <link rel=\"icon\" href=\"./favicon.ico\" type=\"image/x-icon\" />\n <script src=\"https://cdn.plot.ly/plotly-2.16.1.min.js\"></script>\n </head>\n <body>\n <h1>Node-Red WebSocket</h1>\n <div class=\"container\">\n <aside>\n <h2>Real time values</h2>\n <textarea\n id=\"sensor-values\"\n name=\"\"\n class=\"values\"\n cols=\"10\"\n rows=\"20\"\n ></textarea>\n </aside>\n <main class=\"chart\">\n <h2>LDR/Photoresistor</h2>\n <div class=\"wrapper\">\n <div id=\"sensor-chart\" class=\"sensor-chart\"></div>\n </div>\n </main>\n </div>\n <script>{{{payload.script}}}</script>\n </body>\n</html>\n","output":"str","x":870,"y":340,"wires":[["b48f6f14310d044c"]]},{"id":"b48f6f14310d044c","type":"http response","z":"b93e9b260d53649d","name":"","statusCode":"","headers":{},"x":990,"y":240,"wires":[]},{"id":"d24e9af23649e742","type":"comment","z":"b93e9b260d53649d","name":"Web Application","info":"","x":380,"y":180,"wires":[]},{"id":"cc3002e58ce69bc3","type":"comment","z":"b93e9b260d53649d","name":"WebSocket Server","info":"","x":390,"y":440,"wires":[]},{"id":"8dbef215b4efa8a7","type":"websocket-listener","path":"/ws/readings","wholemsg":"false"}]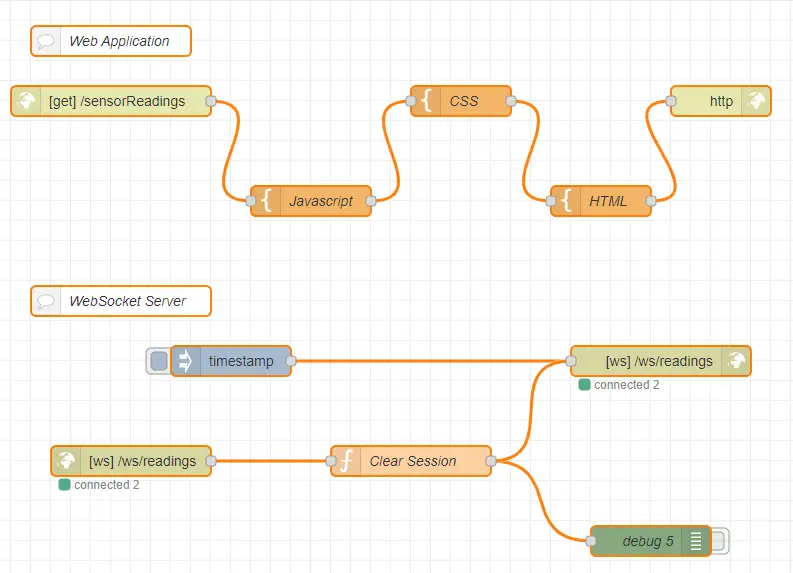
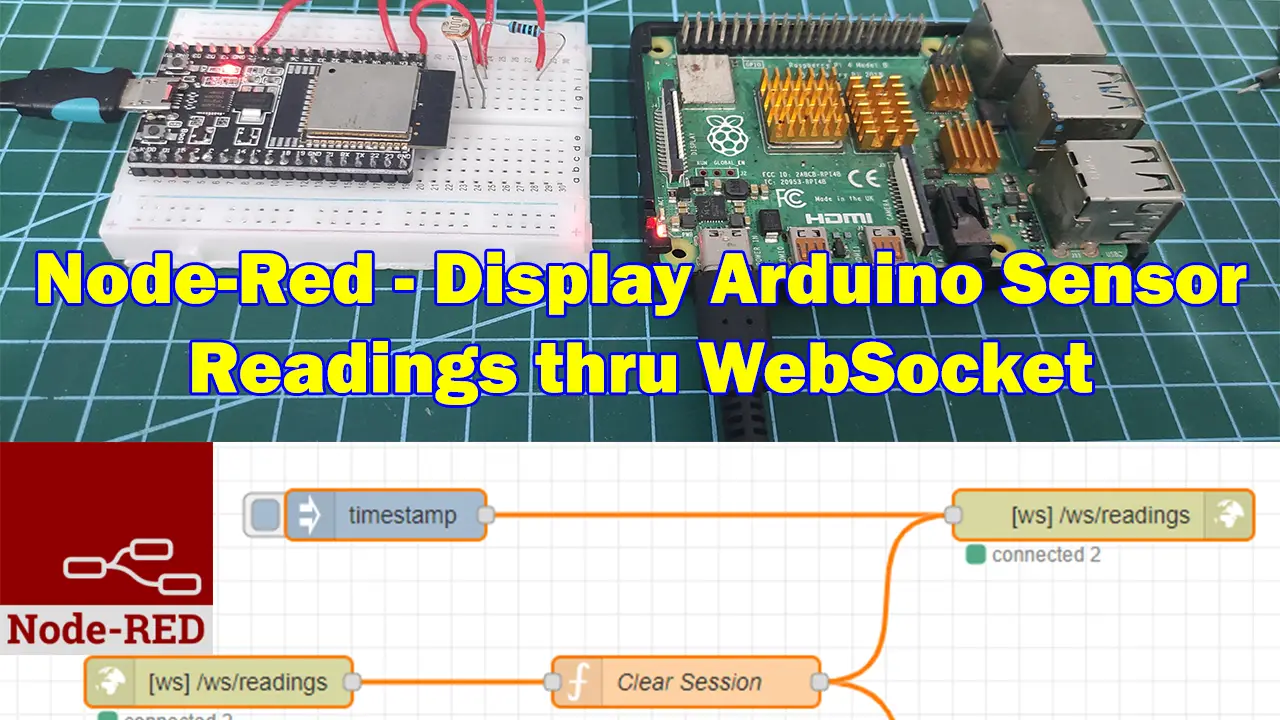
The image above will show you the two sections of our Node-Red flow. The top section shows you the nodes needed in order to create a web application that will display our sensor readings. The bottom section will show you the nodes which handle our WebSocket exchange by creating a WebSocket server inside our Node-Red application.
Let us run through what each node is doing and how the WebSocket server and the web application are configured.
First, we check the WebSocket server nodes setup and what nodes are needed in order to create a working WebSocket server.
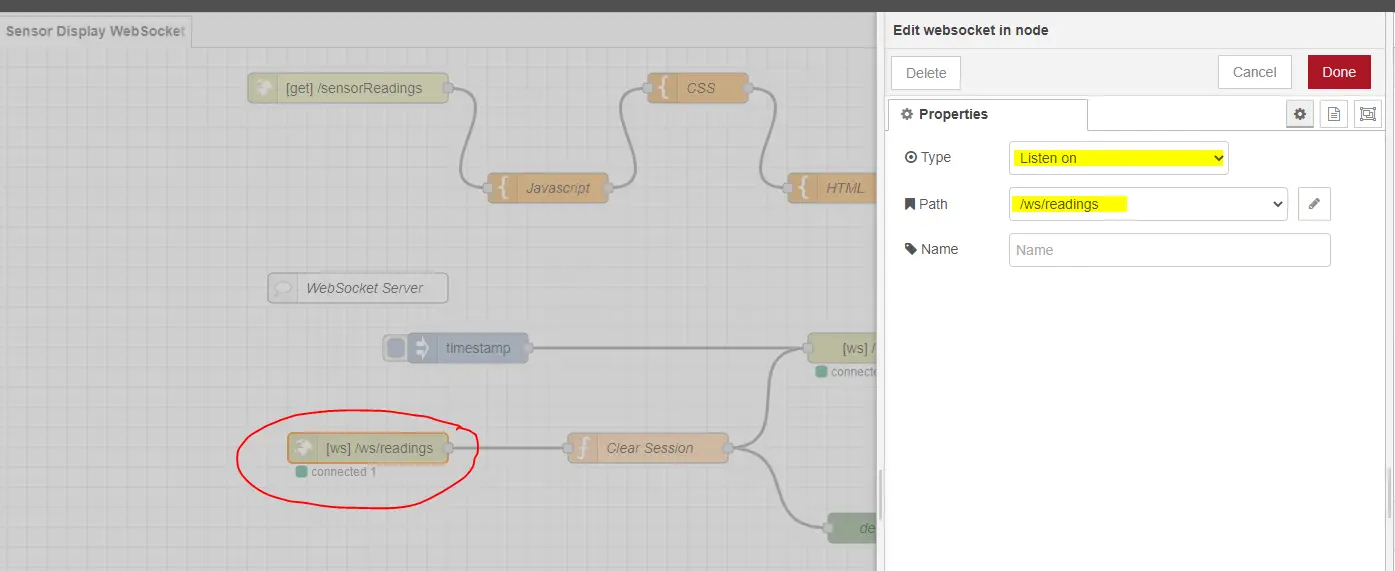
Both the WebSocket In and WebSocket Out node is configured to listen “/ws/readings” path.
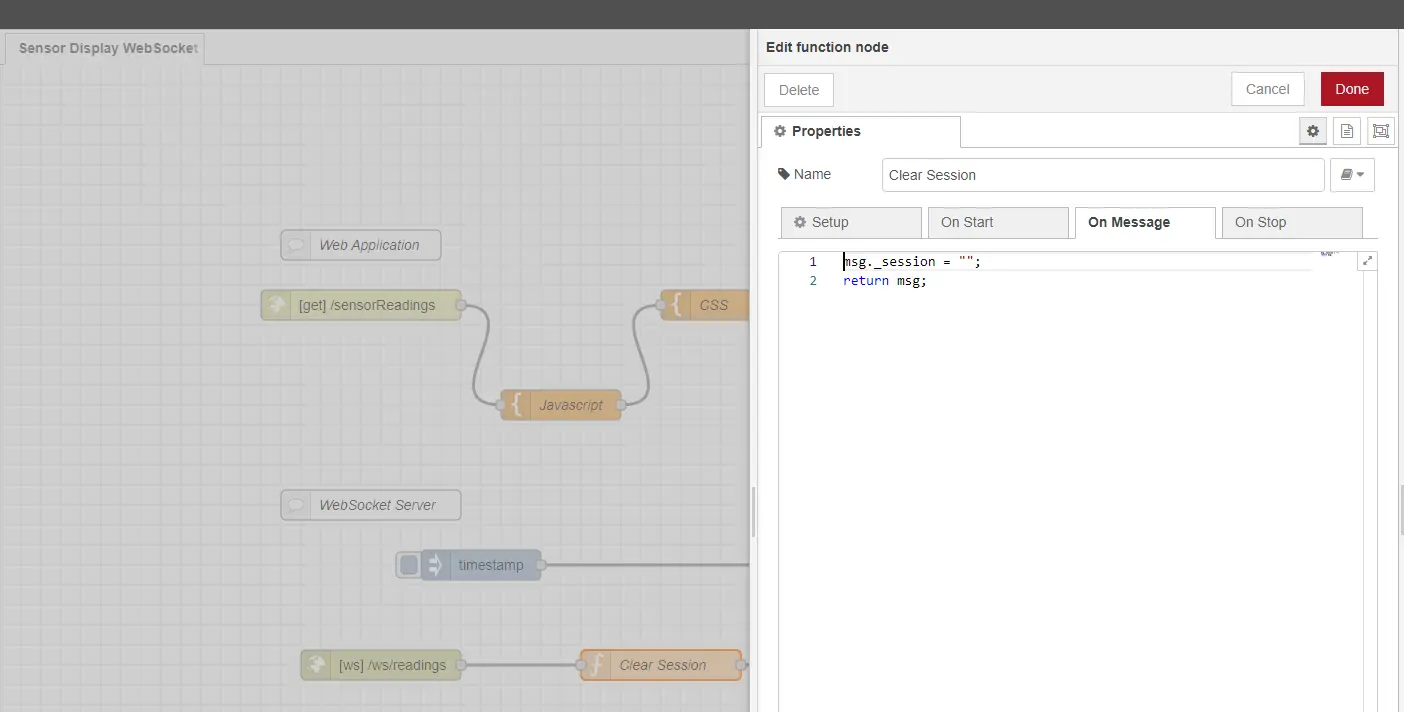
The function node after the WebSocket In node is used to set the session property to a blank value and is used to broadcast the message to our WebSocket Out node.
Next, we check how we have set up the Web Application that will display our LDR or PhotoResistor readings.
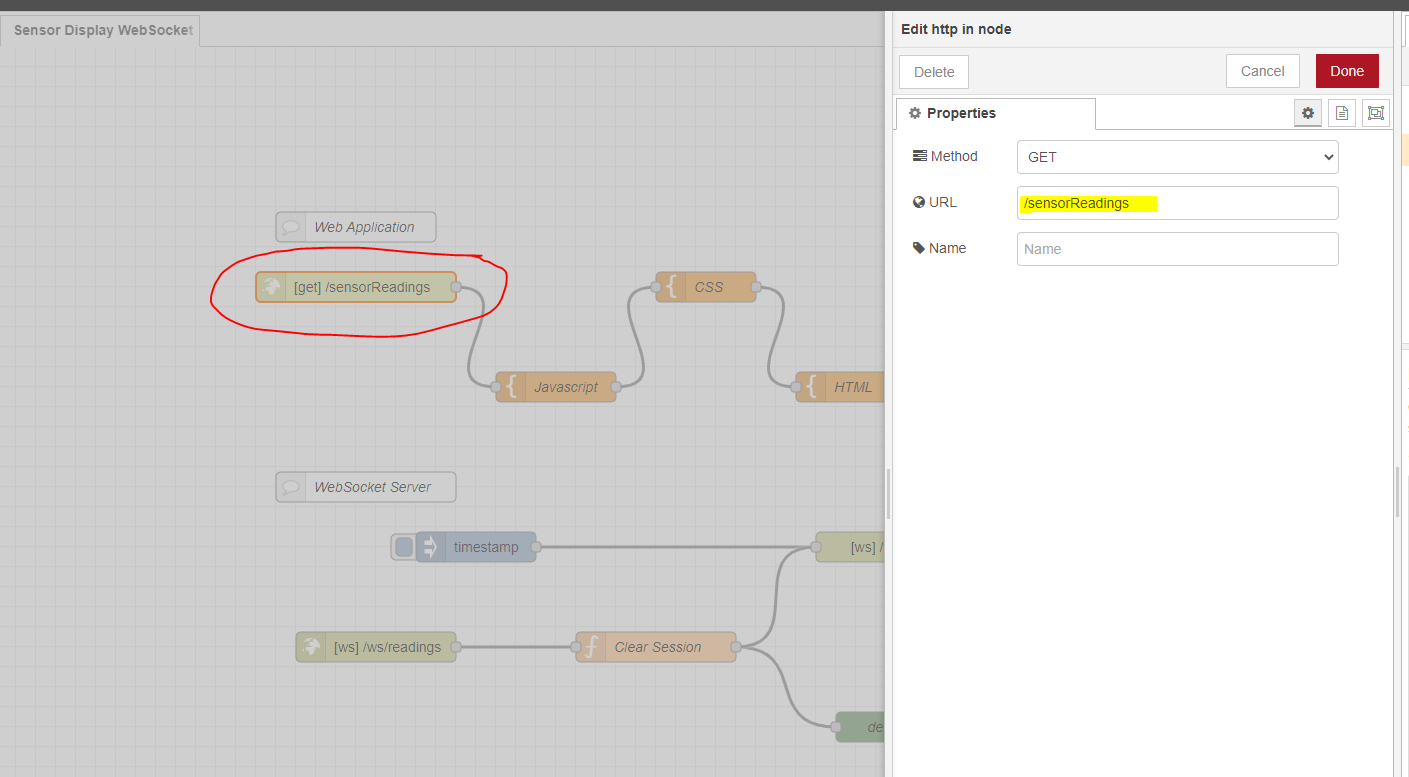
We set the URL to “/sensorReadings” for our HTTP In node so that we could access our web application using the below address.
http://<NODE-RED-IP>:<NODE-RED-PORT>/sensorReadings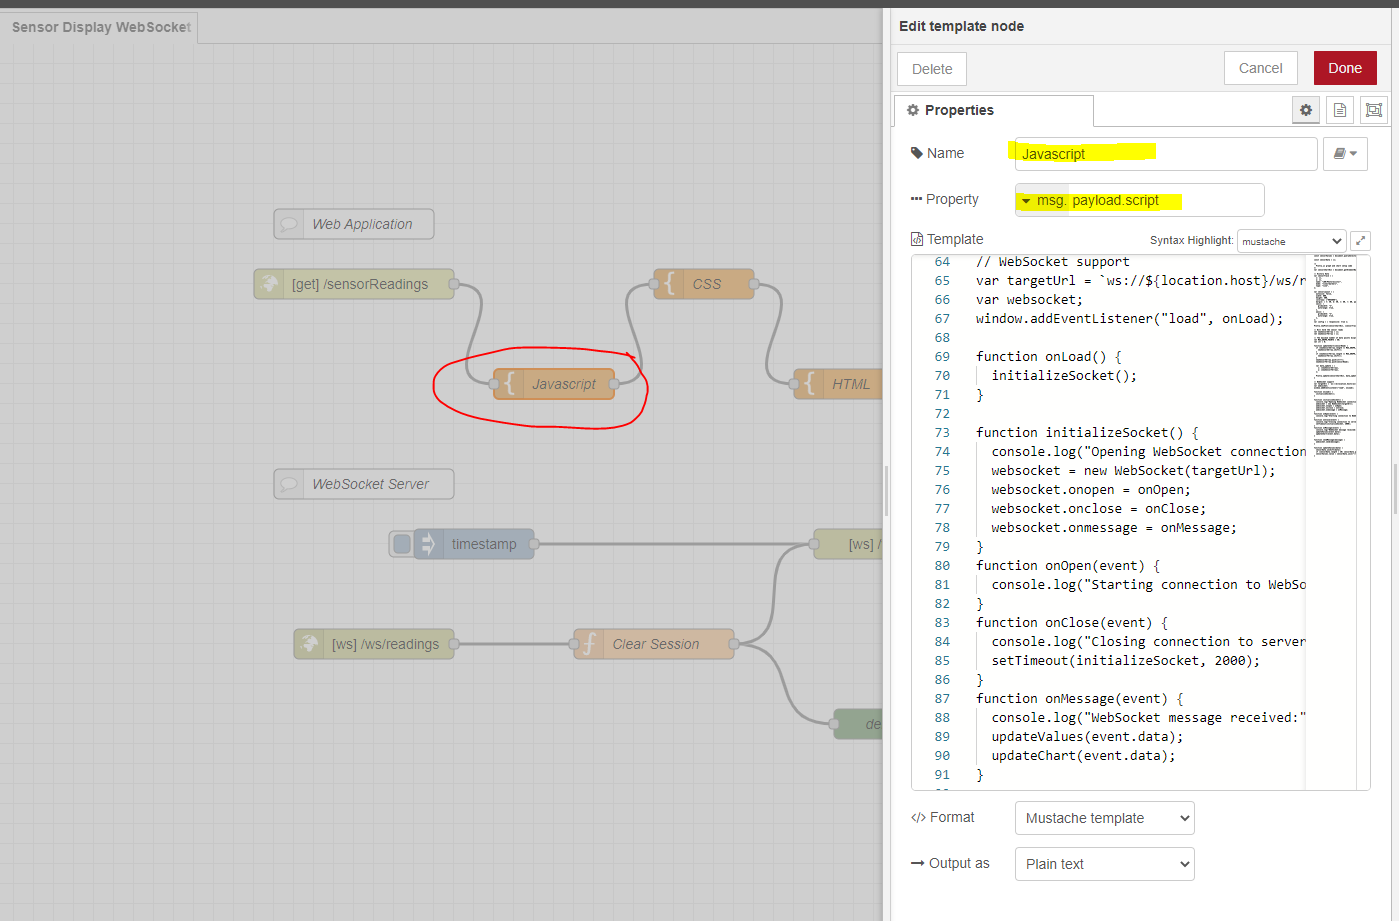
The template named “Javascript” will contain the logic for handling the WebSocket connection and the creation of our Plotly.js chart. It also contains the logic that would asynchronously display the latest sensor readings
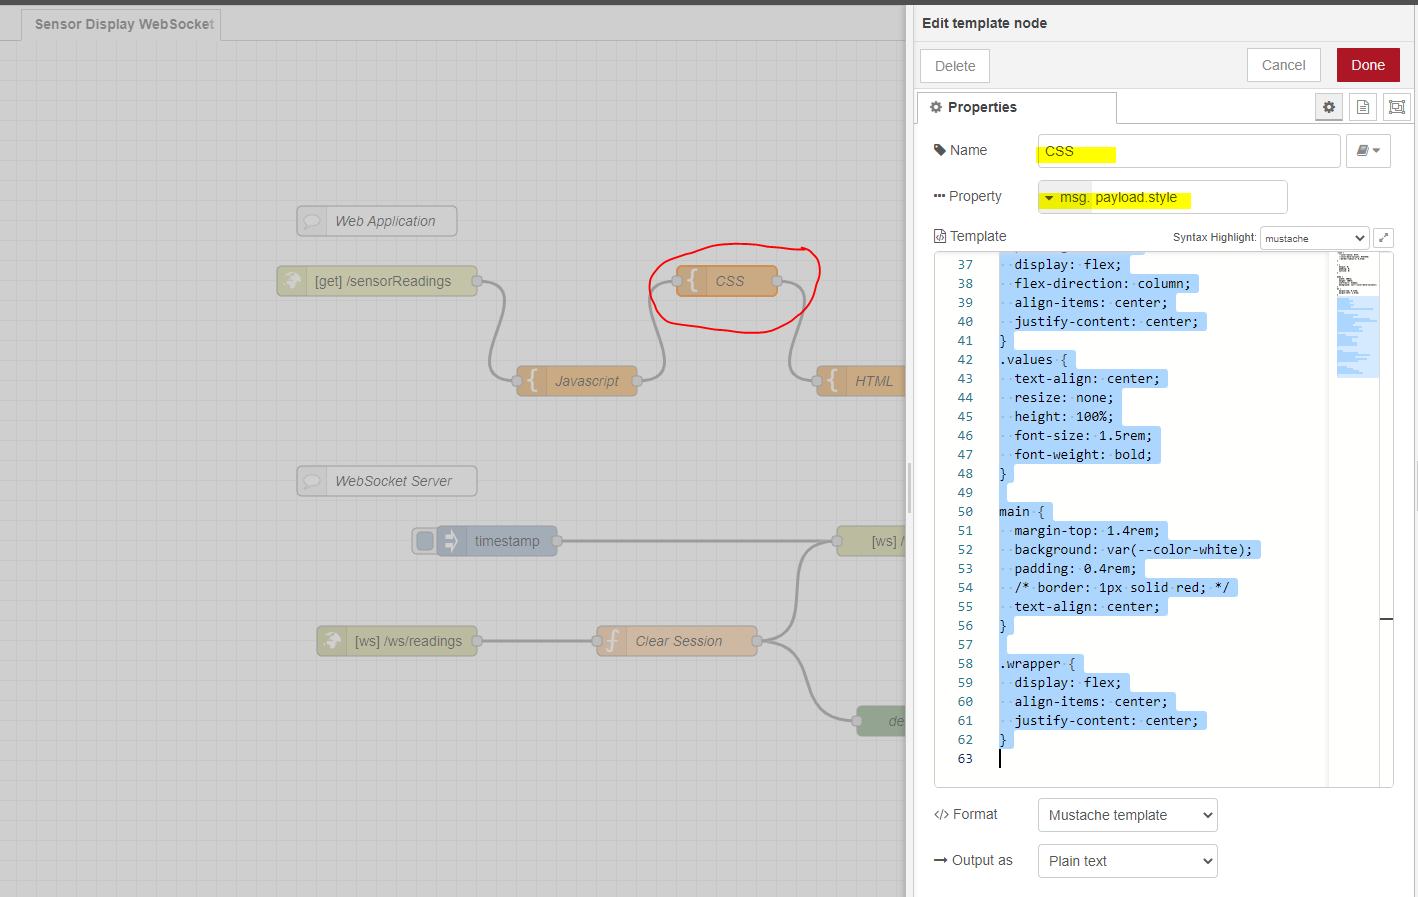
The template named “CSS” will contain our Cascading Style Sheets (CSS) classes which will have a little bit of styling on our page.
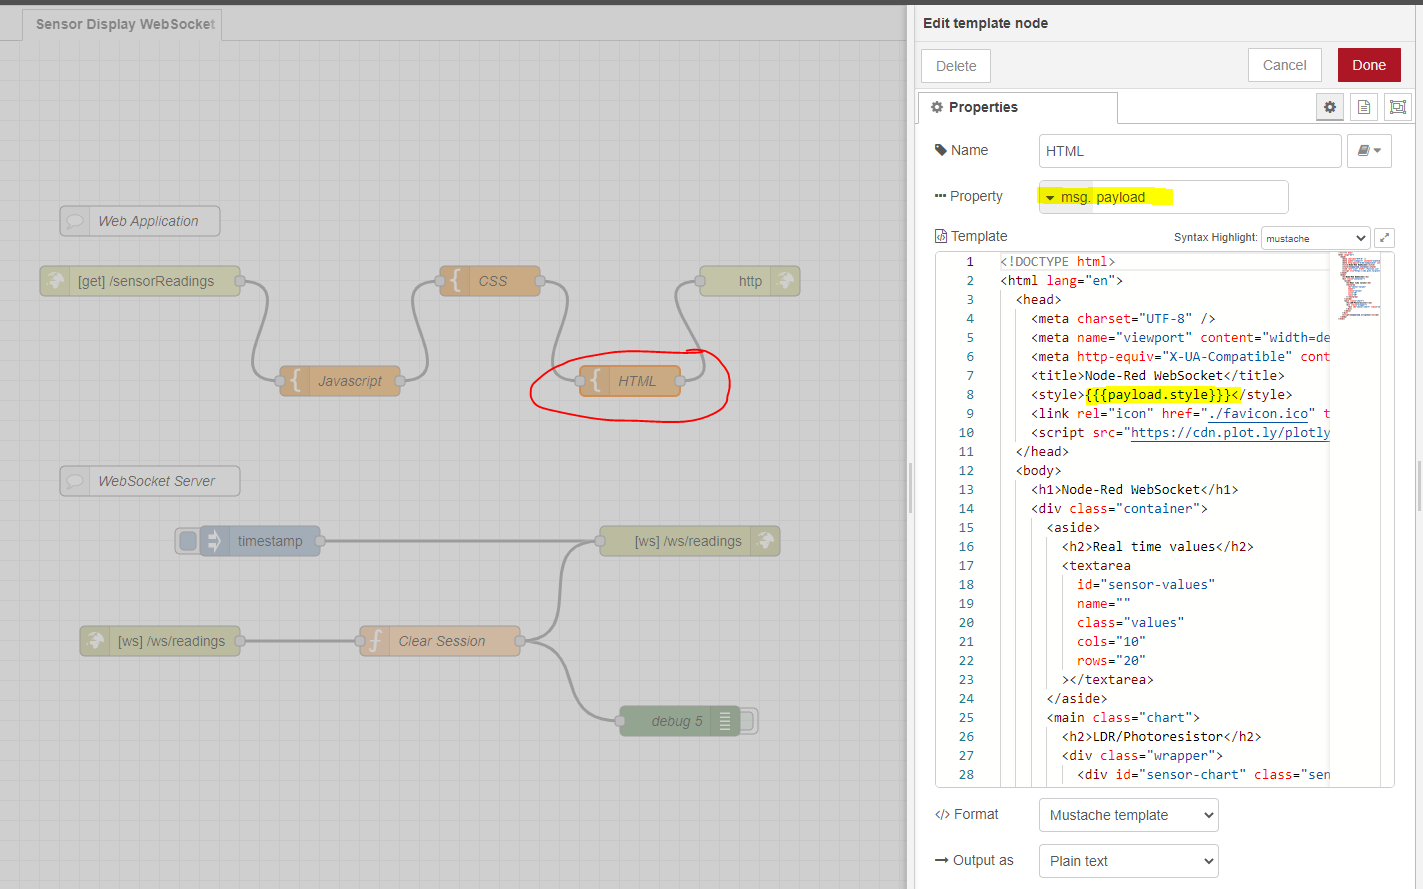
The template named “HTML” will contain the page structure that we will use to display the real-time sensor readings and its chart.
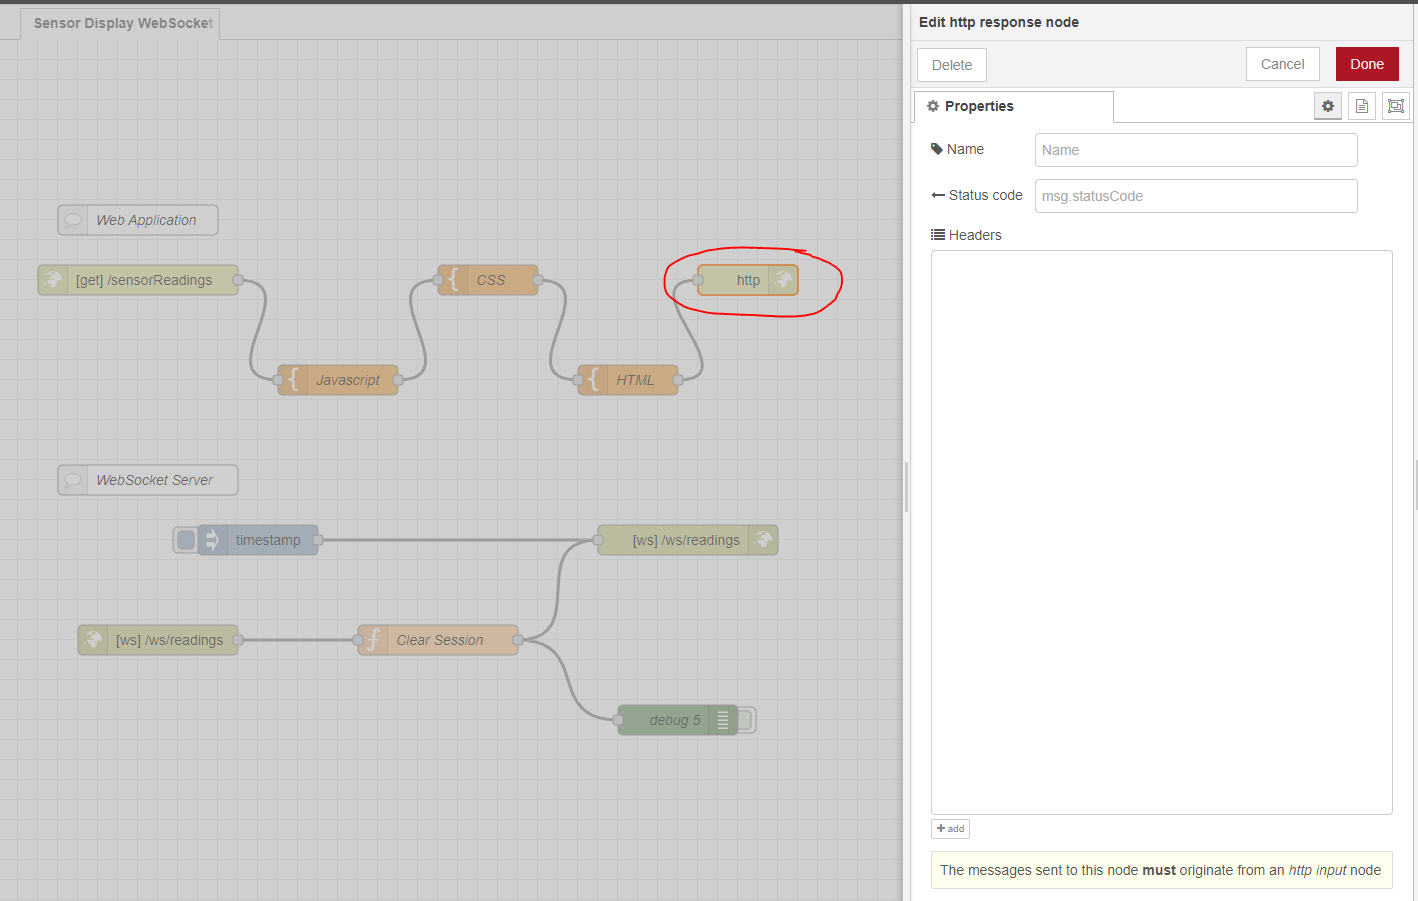
We terminate our Web Application flow with an HTTP response node with default configurations.
Template – HTML
<!DOCTYPE html>
<html lang="en">
  <head>
    <meta charset="UTF-8" />
    <meta name="viewport" content="width=device-width, initial-scale=1.0" />
    <meta http-equiv="X-UA-Compatible" content="ie=edge" />
    <title>Node-Red WebSocket</title>
    <style>{{{payload.style}}}</style>
    <link rel="icon" href="./favicon.ico" type="image/x-icon" />
    <script src="https://cdn.plot.ly/plotly-2.16.1.min.js"></script>
  </head>
  <body>
    <h1>Node-Red WebSocket</h1>
    <div class="container">
      <aside>
        <h2>Real time values</h2>
        <textarea
          id="sensor-values"
          name=""
          class="values"
          cols="10"
          rows="20"
        ></textarea>
      </aside>
      <main class="chart">
        <h2>LDR/Photoresistor</h2>
        <div class="wrapper">
          <div id="sensor-chart" class="sensor-chart"></div>
        </div>
      </main>
    </div>
    <script>{{{payload.script}}}</script>
  </body>
</html>
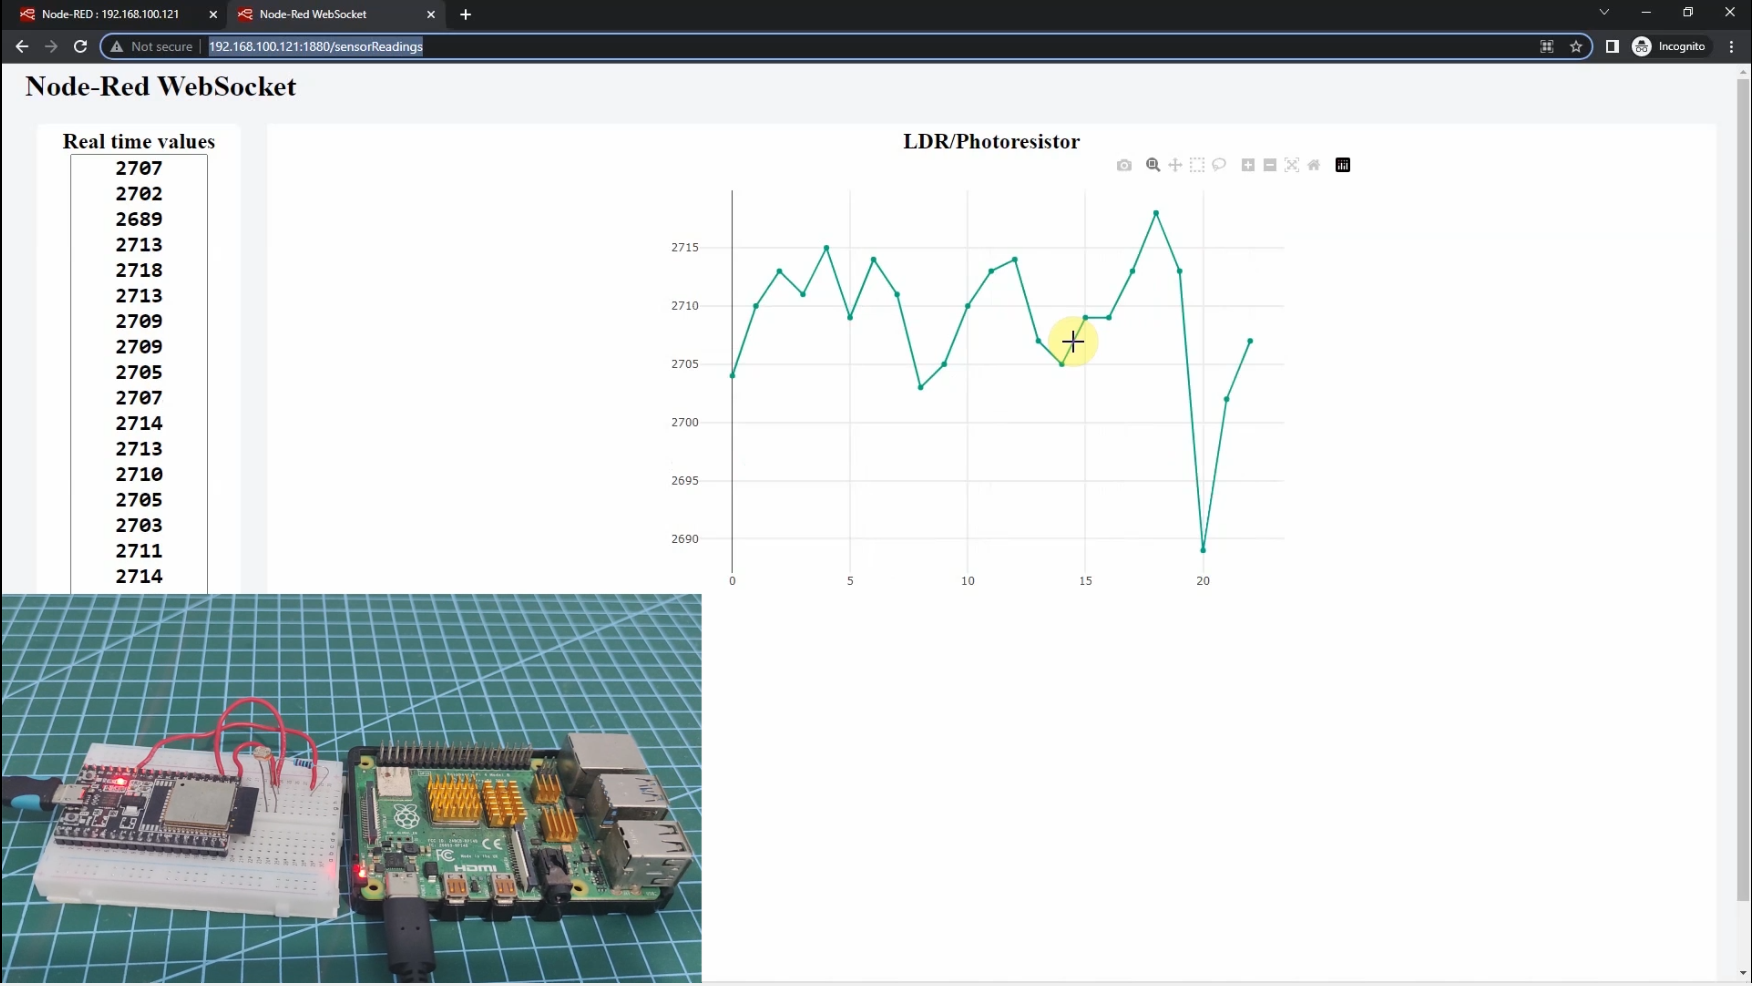
This is our Node-Red Web application user interface that will display the current sensor readings from our LDR or PhotoResistor connected to our ESP32 running Arduino framework.
<!DOCTYPE html>
<html lang="en">
  <head>
    <meta charset="UTF-8" />
    <meta name="viewport" content="width=device-width, initial-scale=1.0" />
    <meta http-equiv="X-UA-Compatible" content="ie=edge" />
    <title>Node-Red WebSocket</title>
    <style>{{{payload.style}}}</style>
    <link rel="icon" href="./favicon.ico" type="image/x-icon" />
    <script src="https://cdn.plot.ly/plotly-2.16.1.min.js"></script>
  </head>
The head section defines some of our meta attributes and the title. We import also the CSS stylesheet by using the <style>{{{payload.style}}}</style> template. Also, Plotly.js is imported as well through CDN.
<body>
    <h1>Node-Red WebSocket</h1>
    <div class="container">
      <aside>
        <h2>Real time values</h2>
        <textarea
          id="sensor-values"
          name=""
          class="values"
          cols="10"
          rows="20"
        ></textarea>
      </aside>
      <main class="chart">
        <h2>LDR/Photoresistor</h2>
        <div class="wrapper">
          <div id="sensor-chart" class="sensor-chart"></div>
        </div>
      </main>
    </div>
    <script>{{{payload.script}}}</script>
  </body>
</html>
We define an HTML textarea at the left-hand side of the screen to display the current sensor readings and the HTML div that will display our Plotly.js chart. After which, we import also Javascript template using the {{{payload.script}}} template at the end of the body section.
Template – Javascript
const sensorValues = document.querySelector("#sensor-values");

const sensorData = [];

/*
  Plotly.js graph and chart setup code
*/
var sensorChartDiv = document.getElementById("sensor-chart");

// History Data
var sensorTrace = {
  x: [],
  y: [],
  name: "LDR/Photoresistor",
  mode: "lines+markers",
  type: "line",
};

var sensorLayout = {
  autosize: false,
  width: 800,
  height: 500,
  colorway: ["#05AD86"],
  margin: { t: 40, b: 40, l: 80, r: 80, pad: 0 },
  xaxis: {
    gridwidth: "2",
    autorange: true,
  },
  yaxis: {
    gridwidth: "2",
    autorange: true,
  },
};
var config = { responsive: true };

Plotly.newPlot(sensorChartDiv, [sensorTrace], sensorLayout, config);

// Will hold the sensor reads
let newSensorXArray = [];
let newSensorYArray = [];

// The maximum number of data points displayed on our scatter/line graph
let MAX_GRAPH_POINTS = 50;
let ctr = 0;

function updateChart(sensorRead) {
  if (newSensorXArray.length >= MAX_GRAPH_POINTS) {
    newSensorXArray.shift();
  }
  if (newSensorYArray.length >= MAX_GRAPH_POINTS) {
    newSensorYArray.shift();
  }
  newSensorXArray.push(ctr++);
  newSensorYArray.push(sensorRead);

  var data_update = {
    x: [newSensorXArray],
    y: [newSensorYArray],
  };

  Plotly.update(sensorChartDiv, data_update);
}

// WebSocket support
var targetUrl = `ws://${location.host}/ws/readings`;
var websocket;
window.addEventListener("load", onLoad);

function onLoad() {
  initializeSocket();
}

function initializeSocket() {
  console.log("Opening WebSocket connection Node-Red Server...");
  websocket = new WebSocket(targetUrl);
  websocket.onopen = onOpen;
  websocket.onclose = onClose;
  websocket.onmessage = onMessage;
}
function onOpen(event) {
  console.log("Starting connection to WebSocket server..");
}
function onClose(event) {
  console.log("Closing connection to server..");
  setTimeout(initializeSocket, 2000);
}
function onMessage(event) {
  console.log("WebSocket message received:", event);
  updateValues(event.data);
  updateChart(event.data);
}

function sendMessage(message) {
  websocket.send(message);
}

function updateValues(data) {
  sensorData.unshift(data);
  if (sensorData.length > 20) sensorData.pop();
  sensorValues.value = sensorData.join("\r\n");
}
Most of the functionality of our web application is done by this file so it is important to discuss what each line of the code does.
const sensorValues = document.querySelector("#sensor-values");

const sensorData = [];

/*
  Plotly.js graph and chart setup code
*/
var sensorChartDiv = document.getElementById("sensor-chart");
We declare the HTML elements that will contain our chart and what will show the latest readings from our sensor.
/*
  Plotly.js graph and chart setup code
*/
var sensorChartDiv = document.getElementById("sensor-chart");

// History Data
var sensorTrace = {
  x: [],
  y: [],
  name: "LDR/Photoresistor",
  mode: "lines+markers",
  type: "line",
};

var sensorLayout = {
  autosize: false,
  width: 800,
  height: 500,
  colorway: ["#05AD86"],
  margin: { t: 40, b: 40, l: 80, r: 80, pad: 0 },
  xaxis: {
    gridwidth: "2",
    autorange: true,
  },
  yaxis: {
    gridwidth: "2",
    autorange: true,
  },
};
var config = { responsive: true };

Plotly.newPlot(sensorChartDiv, [sensorTrace], sensorLayout, config);
This is our Plotly.js configuration for our line chart. The following are needed in order to draw the line chart trace.
// Will hold the sensor reads
let newSensorXArray = [];
let newSensorYArray = [];

// The maximum number of data points displayed on our scatter/line graph
let MAX_GRAPH_POINTS = 50;
let ctr = 0;

function updateChart(sensorRead) {
  if (newSensorXArray.length >= MAX_GRAPH_POINTS) {
    newSensorXArray.shift();
  }
  if (newSensorYArray.length >= MAX_GRAPH_POINTS) {
    newSensorYArray.shift();
  }
  newSensorXArray.push(ctr++);
  newSensorYArray.push(sensorRead);

  var data_update = {
    x: [newSensorXArray],
    y: [newSensorYArray],
  };

  Plotly.update(sensorChartDiv, data_update);
}
We are saving our LDR or Photoresistor readings in the storage arrays newSensorXArray and newSensorYArray. We are only saving the last 50 readings. The function updateChart() will update our arrays. It checks if the maximum readings were reached and if yes then it drops the last record and saves the new one to our storage arrays. Lastly, it updates our charts to display the storage arrays in our chart.
// WebSocket support
var targetUrl = `ws://${location.host}/ws/readings`;
var websocket;
window.addEventListener("load", onLoad);

function onLoad() {
  initializeSocket();
}

function initializeSocket() {
  console.log("Opening WebSocket connection Node-Red Server...");
  websocket = new WebSocket(targetUrl);
  websocket.onopen = onOpen;
  websocket.onclose = onClose;
  websocket.onmessage = onMessage;
}
function onOpen(event) {
  console.log("Starting connection to WebSocket server..");
}
function onClose(event) {
  console.log("Closing connection to server..");
  setTimeout(initializeSocket, 2000);
}
function onMessage(event) {
  console.log("WebSocket message received:", event);
  updateValues(event.data);
  updateChart(event.data);
}

function sendMessage(message) {
  websocket.send(message);
}

function updateValues(data) {
  sensorData.unshift(data);
  if (sensorData.length > 20) sensorData.pop();
  sensorValues.value = sensorData.join("\r\n");
}
These are our WebSocket handling logic wherein we connect to our WebSocket server. We declare several callback functions that would be called whenever an event occurred in our WebSocket connection.
The important callback is the onMessage() which handles the WebSocket message coming from our Node-Red WebSocket server. Upon receiving a message then we update our chart and the list of current values.
Template – CSS
:root {
  --color-white: #fff;
  --color-dark-variant: #f3f5f8;
  --border-radius-1: 0.4rem;
}

* {
  margin: 0;
  padding: 0;
  outline: 0;
}

body {
  width: 100vw;
  height: 100vh;
  overflow-x: hidden;
  background: var(--color-dark-variant);
}
h1 {
  margin-top: 0.4rem;
  margin-left: 1.6rem;
}

.container {
  display: grid;
  width: 96%;
  margin: 0 auto;
  gap: 1.8rem;
  grid-template-columns: 14rem auto;
}
aside {
  margin-top: 1.4rem;
  height: 100vh;
  background: var(--color-white);
  border-radius: var(--border-radius-1);
  padding: 0.4rem;
  display: flex;
  flex-direction: column;
  align-items: center;
  justify-content: center;
}
.values {
  text-align: center;
  resize: none;
  height: 100%;
  font-size: 1.5rem;
  font-weight: bold;
}

main {
  margin-top: 1.4rem;
  background: var(--color-white);
  padding: 0.4rem;
  /* border: 1px solid red; */
  text-align: center;
}

.wrapper {
  display: flex;
  align-items: center;
  justify-content: center;
}
These are our minimal stylesheet classes that will beautify our page. I won’t be discussing so much about this code as these are standard CSS stylesheet classes.
Wrap Up
We have successfully programmed our Node-Red application to display real-time sensor readings from our Arduino board in this post using WebSocket.
Leave a Reply