Introduction
This post will teach you how to interface your DS18B20 temperature sensor with your ESP32 MicroPython device. We will first learn how to program this sensor and we will expand this knowledge by creating our own custom weather station.
If you want to see this project in a video format then please see below. You can also watch this on my YouTube channel.
Prerequisites
The following are the needed components to be able to follow with this project.
- MicroPython Device with Wifi capability (I used NodeMCU ESP32s) – Amazon | AliExpress | Bangood
- DS18B20 Temperature sensor module (In PCB form) – Amazon | AliExpress
- Breadboard – Amazon | AliExpress | Bangood
- Jumper Wires – Amazon | AliExpress | Bangood
Disclosure: These are affiliate links and I will earn small commissions to support my site when you buy through these links.
You should have installed the latest MicroPython firmware on your device. I am using Thonny IDE as my development platform but you can use other IDE such as Visual Studio Code or uPyCraft IDE.
Related Content:
How to install MicroPython on ESP32 and download firmware
MicroPython Development Using Thonny IDE
What is the DS18B20?
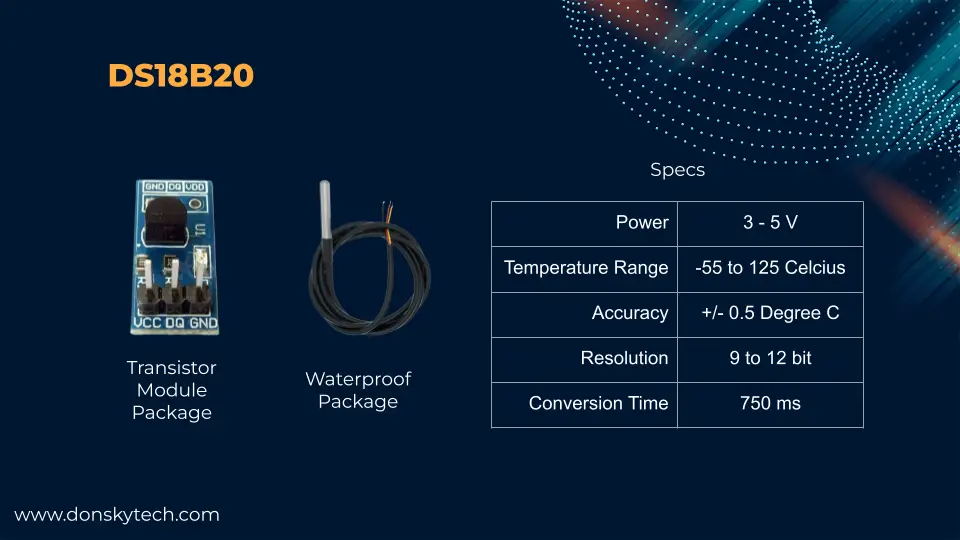
The DS18B20 temperature sensor has an excellent and high accuracy characteristic that was originally developed by Dallas Semiconductor. It mainly uses the 1-Wire protocol wherein a single data line and ground is enough to power and communicate with the device. The important specification is shown above and we will use the following information in our MicroPython program later.
You can choose to connect multiple DS18B20s on the same 1-Wire bus as each DS18B20 is configured with a unique 64-bit serial number. It comes in two packages, the first is the transistor-like package and the other is the waterproof package that is applicable for underwater operations. The common applications of these sensors are for weather monitoring, HVAC, thermostat controls, and industrial systems.
In this post, we are gonna be using the transistor package module that is contained in a PCB with other components.
Schematic/Wiring
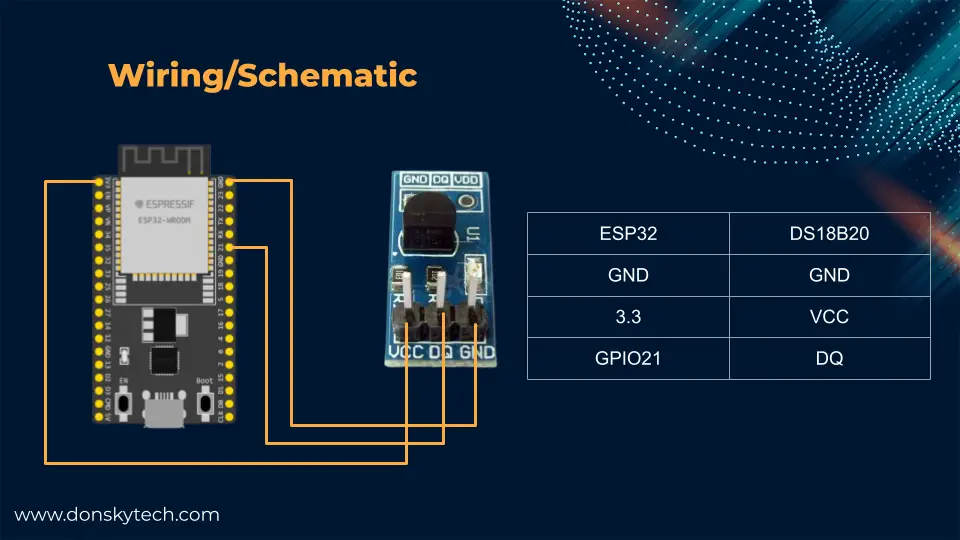
The image above is the schematic/wiring diagram of our DS18B20 MicroPython weather station project. The DS18B20 only has 3 pins exposed and we will just follow the table above for our connection. You can choose other GPIO pins of your choice as any other pins support the 1-Wire protocol.
Code
Basic Read
The code to communicate with a DS18B20 temperature sensor with MicroPython is very easy as there are classes/packages built already in the library out of the box. You can take a look at the following link in the official MicroPython documentation to learn more.
import machine, onewire, ds18x20, time

ds_pin = machine.Pin(21)
ds_sensor = ds18x20.DS18X20(onewire.OneWire(ds_pin))

roms = ds_sensor.scan()

if not roms:
    raise RuntimeError("Found no DS18b20")

while True:
  ds_sensor.convert_temp()
  time.sleep_ms(750)
  for rom in roms:
    print(ds_sensor.read_temp(rom))
  time.sleep(1)
To learn more about how the code work so let us try to step through it one by one.
import machine, onewire, ds18x20, timeImport the necessary library/packages to communicate with our OneWire DS18B20 sensor.
ds_pin = machine.Pin(21)
ds_sensor = ds18x20.DS18X20(onewire.OneWire(ds_pin))
Declare the necessary GPIO pin that we will use to communicate with our DS18B20 temperature sensor. Create the class DS18X20 by passing in the OneWire object that we will use to get the temperature reading.
roms = ds_sensor.scan()

if not roms:
    raise RuntimeError("Found no DS18b20")
Call the scan() method scan for any DS18B20 sensor attached to our ESP32. If no DS18B20 sensor is not detected then we raise a runtime error else we read the temperature by calling the read_temp() method on the DS18b20 sensor object that we have.
while True:
  ds_sensor.convert_temp()
  time.sleep_ms(750)
  for rom in roms:
    print(ds_sensor.read_temp(rom))
  time.sleep(1)
This is an infinite loop that will continually sample sensor reads from our DS18B20 sensor. You should call the convert_temp() method in our DS18X20 class to start temperature conversions. The 750 milliseconds sleep command is needed to allow the sensor to sample its reading. After which, we start reading the temperature by calling the read_temp(rom) for each attached DS18B20 sensor. We print the values and then sleep for another second before beginning the loop sequence again.
As you can see, that is how easy it is to interface and read the temperature readings of a DS18B20 sensor using our MicroPython code. Now that you know the basics of how to wire and program this sensor then let’s make it more interesting by displaying the sensor readings in a graphical manner.
DS18B20 Weather Station
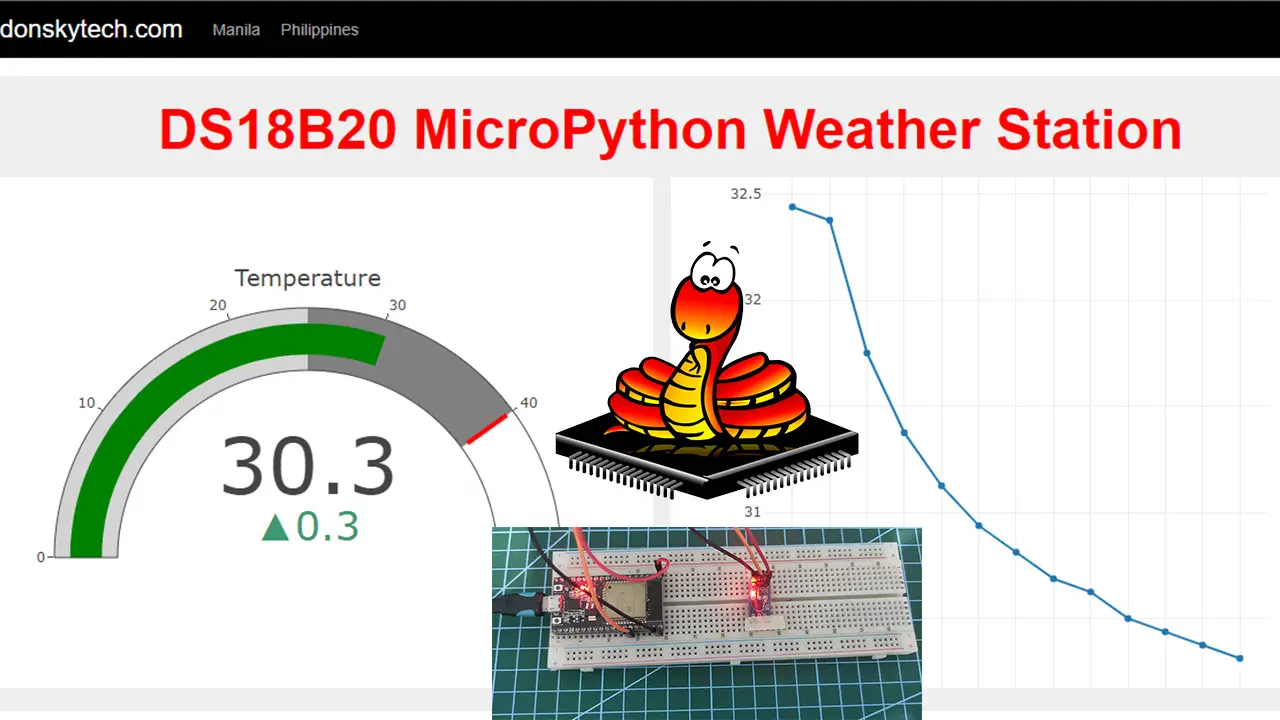
We are going to build our own custom DS18B20 Weather Station that will display the sensor readings in a graphical format.
The first graph will show the latest reading of our DS18B20 sensor while the next graph will display the last 12 sensor readings. The user interface automatically updates its display of sensor readings asynchronously.
I have used the MicroDot library in developing this project so if you are not familiar with how this library works then I highly suggest that you go through the following links.
Must Read:
Develop MicroPython Application using MicroDot
How to create a MicroPython Web Server the easy way!
Let me walk you through how this project works.
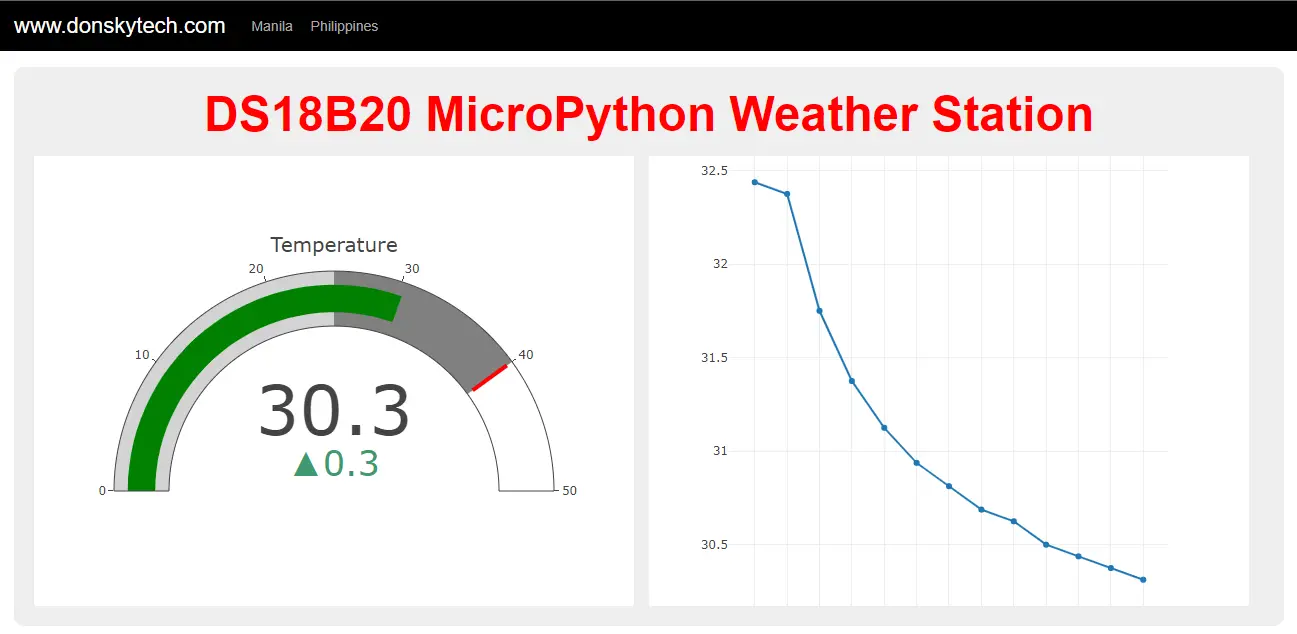
Design
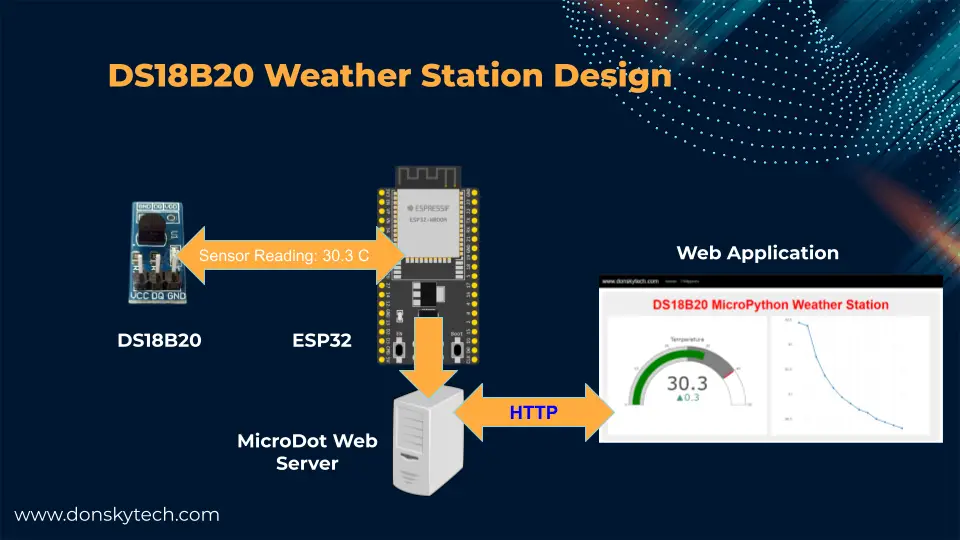
The image above is the overall design of our DS18B20 MicroPython Weather Station. As you can see, we have created a web server inside our ESP32 device using the MicroDot library. The MicroDot library then creates a web application that displays sensor readings in a graph using the Plotly.js javascript library.
We have configured our web application to request the latest sensor readings every 3 seconds. Whenever this request is received by our ESP32 MicroPython device then it will communicate with our DS18B20 to sample a temperature reading. Once the ESP32 receives the temperature readout then it sends it back to our web application thru HTTP and the web application will asynchronously update its user interface.
Anatomy of our Graph Chart
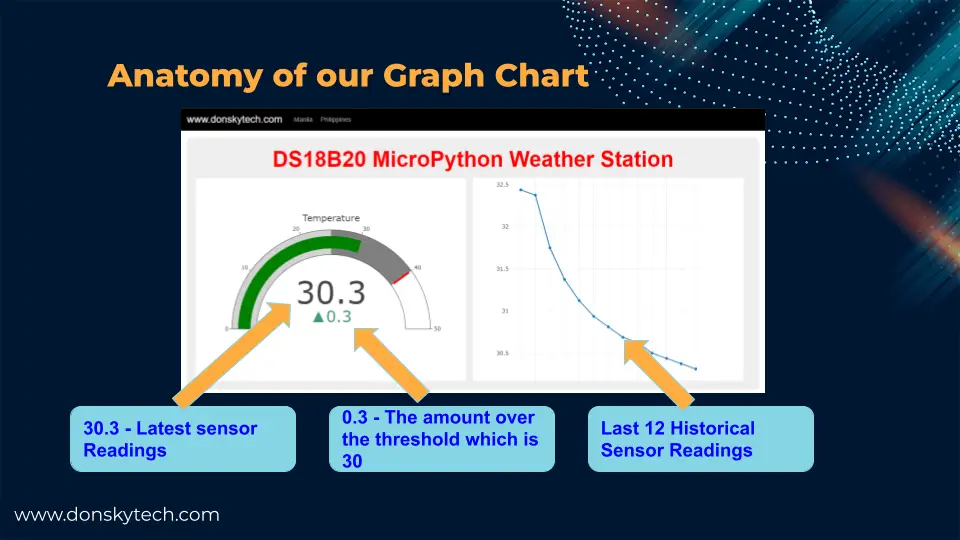
The image above is the details of the information that we are showing in our graph chart. First, our Gauge Chart to the left is showing the latest sensor reading and the number below it is showing the amount that is over our threshold value. I have set the threshold value to 30 degrees but this is configurable.
The Line chart at the right on the other hand shows the last 12 sensor readings. It automatically removes the earliest record when the count reaches 12.
Both these values automatically update asynchronously and there is no need for you to click any button for it to refresh its values.
Now that we know already what we are building then let’s see the part of the code that makes this work.
Code
The complete code for this project is in my GitHub repository. You can either download it as a zip file or clone it using Git and the below command.
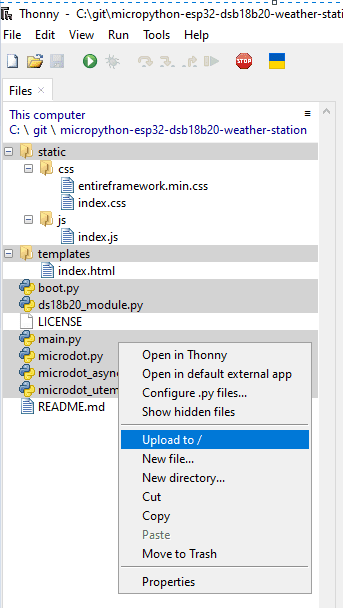
git clone https://github.com/donskytech/micropython-esp32-dsb18b20-weather-stationOpen the following project in Thonny IDE to get a better view of the files involved in the project.
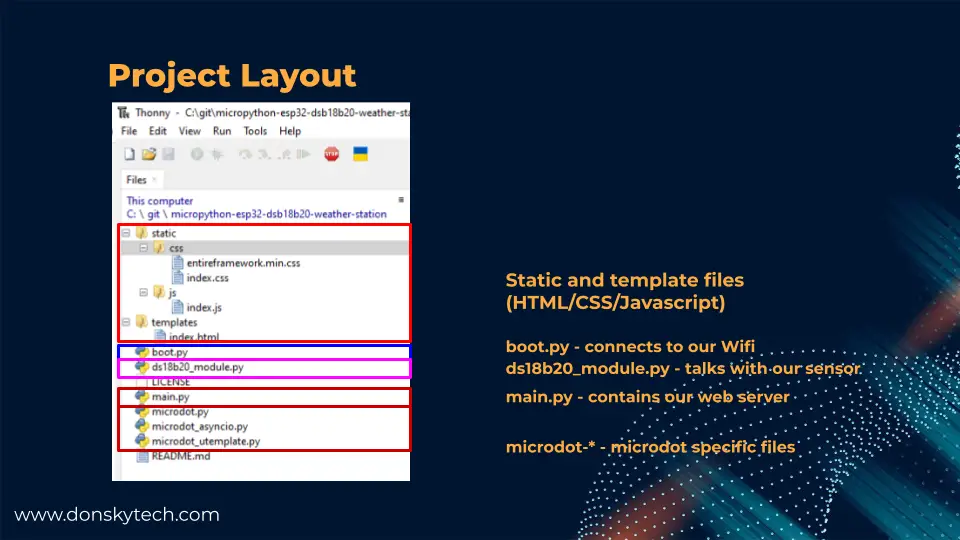
The image above will show you the project layout of our DS18B20 MicroPython Weather Station. It consists mainly of the following files/directories
- static/css – this directory contains the Cascading Style Sheets (CSS) that will style our index.html.
- /static/js – this directory contains the javascript files that will control our graphical charts and synchronously update our web page.
- templates/index.html – this is our root page that contains the HTML elements to display our user interface.
- boot.py – connects to our Wifi network. This is executed whenever our MicroPython device is restarted
- ds18b20_module.py – this contains the logic that will connect to our DS18B20 sensor and retrieve the temperature readings.
- main.py – this contains our web server routes
- microdot-* – these are microdot-specific source files.
Let’s drill down further about what the code on each file does.
ds18b20_module.py
The code for this module is almost similar to the basic code above about how to read the temperature readings from your DS18B20 sensor.
from machine import Pin,
import onewire, ds18x20, time


class DS18b20Module:
    def __init__(self, pin_number):
        self.ds_pin = Pin(pin_number)
        self.ds_sensor = ds18x20.DS18X20(onewire.OneWire(self.ds_pin))

    def get_temp_reading(self):
        roms = self.ds_sensor.scan()

        if not roms:
            raise RuntimeError("Found no DS18b20")

        self.ds_sensor.convert_temp()
        time.sleep_ms(750)


        temp = self.ds_sensor.read_temp(roms[0])
        print(f"Temperature is {temp}")
        return temp
from machine import Pin,
import onewire, ds18x20, timeWe import the necessary packages, especially the onewire and ds18x20 which we will be using to interface with our DS18B20.
class DS18b20Module:
    def __init__(self, pin_number):
        self.ds_pin = Pin(pin_number)
        self.ds_sensor = ds18x20.DS18X20(onewire.OneWire(self.ds_pin))
We define a class DS18b20Module and its constructor we passed in the GPIO pin number that we will be using. Also, we create an instance of the OneWire class passing in the GPIO Pin. The same OneWire class is used to instantiate an instance of our DS18X20
    def get_temp_reading(self):
        roms = self.ds_sensor.scan()

        if not roms:
            raise RuntimeError("Found no DS18b20")

        self.ds_sensor.convert_temp()
        time.sleep_ms(750)


        temp = self.ds_sensor.read_temp(roms[0])
        print(f"Temperature is {temp}")
        return
The get_temp_reading() method of our DS18b20Module class will read the temperature readings of our DS18B20. The code is almost similar to the one that we have above.
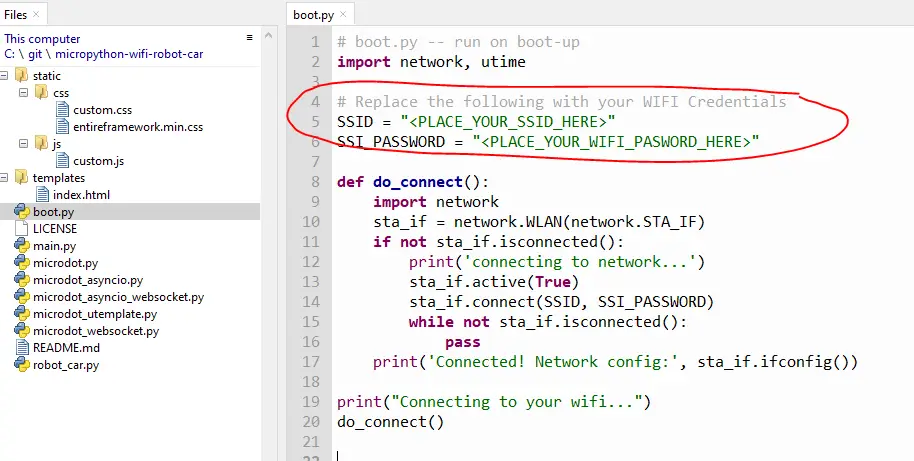
boot.py
As stated above this file gets executed by MicroPython whenever it restarts and its main role is to connect to our Wifi.
# boot.py -- run on boot-up
import network, utime

# Replace the following with your WIFI Credentials
SSID = "<PLACE_YOUR_SSID_HERE>"
SSI_PASSWORD = "<PLACE_YOUR_WIFI_PASWORD_HERE>"

def do_connect():
    import network
    sta_if = network.WLAN(network.STA_IF)
    if not sta_if.isconnected():
        print('connecting to network...')
        sta_if.active(True)
        sta_if.connect(SSID, SSI_PASSWORD)
        while not sta_if.isconnected():
            pass
    print('Connected! Network config:', sta_if.ifconfig())

print("Connecting to your wifi...")
do_connect()
# boot.py -- run on boot-up
import network, utime
# Replace the following with your WIFI Credentials
SSID = "<PLACE_YOUR_SSID_HERE>"
SSI_PASSWORD = "<PLACE_YOUR_WIFI_PASWORD_HERE>"First, we import the necessary package that we will use in order to connect to our network. Next, we need to change the following variables (SSID and SSI_PASSWORD) to the appropriate network credentials of your Wifi.
def do_connect():
    import network
    sta_if = network.WLAN(network.STA_IF)
    if not sta_if.isconnected():
        print('connecting to network...')
        sta_if.active(True)
        sta_if.connect(SSID, SSI_PASSWORD)
        while not sta_if.isconnected():
            pass
    print('Connected! Network config:', sta_if.ifconfig())

print("Connecting to your wifi...")
do_connect()
We then define a method called do_connect() to connect to our Wifi network and print the assigned network configuration.
main.py
This file serves as our web server file that contains several routes being used to serve HTTP requests. You should have read the must-read links above about how to work with MicroDot if you are not familiar with how it works.
from microdot_asyncio import Microdot, Response, send_file
from microdot_utemplate import render_template
from ds18b20_module import DS18b20Module
import ujson

DS_PIN = 21

# Our DS18B20 Module
ds_sensor = DS18b20Module(DS_PIN)

app = Microdot()
Response.default_content_type = 'text/html'


@app.route('/')
async def index(request):
    return render_template('index.html')


@app.route('/updateValues')
async def get_ds18b20_reads(request):
    print("Receive get values request!")
    sensor_reads = ds_sensor.get_temp_reading()
    return ujson.dumps({"reading" : sensor_reads})


@app.route('/shutdown')
async def shutdown(request):
    request.app.shutdown()
    return 'The server is shutting down...'


@app.route('/static/<path:path>')
def static(request, path):
    if '..' in path:
        # directory traversal is not allowed
        return 'Not found', 404
    return send_file('static/' + path)

app.run()
Let’s walk thru what each line does.
from microdot_asyncio import Microdot, Response, send_file
from microdot_utemplate import render_template
from ds18b20_module import DS18b20Module
import ujson
We import the necessary MicroDot-specific files and our DS18b20Module class.
DS_PIN = 21

# Our DS18B20 Module
ds_sensor = DS18b20Module(DS_PIN)

app = Microdot()
Response.default_content_type = 'text/html'
We declare our DS18B20 pin and initialize our DS18b20Module class. After this, we created an instance of our MicroDot class.
@app.route('/')
async def index(request):
    return render_template('index.html')


@app.route('/updateValues')
async def get_ds18b20_reads(request):
    print("Receive get values request!")
    sensor_reads = ds_sensor.get_temp_reading()
    return ujson.dumps({"reading" : sensor_reads})
We declare two routes (index() and get_ds18b20_reads()) which will serve our root index.html (“/”) and “/updateValues” routes.
@app.route('/shutdown')
async def shutdown(request):
    request.app.shutdown()
    return 'The server is shutting down...'


@app.route('/static/<path:path>')
def static(request, path):
    if '..' in path:
        # directory traversal is not allowed
        return 'Not found', 404
    return send_file('static/' + path)

app.run()
The routes above will shut down our application and serve our static files (HTML/CSS/Javascript). Also, it will run our MicroDot web server.
templates/index.html
This is the root user interface of our web application and will contain the graphical charts that will display our DS18B20 readings.
<!DOCTYPE html>
<html>
   <head>
      <meta charset="UTF-8" />
      <meta name="viewport" content="width=device-width, initial-scale=1" />
      <title>DS18B20 Weather Station</title>
      <link rel="stylesheet" href="static/css/entireframework.min.css" />
      <link rel="stylesheet" href="static/css/index.css" />
      <!-- Load plotly.js into the DOM -->
      <script src='https://cdn.plot.ly/plotly-2.16.1.min.js'></script>
   </head>
   <body>
      <script src="static/js/index.js"></script>
      <nav class="nav" tabindex="-1" onclick="this.focus()">
         <div class="container">
            <a class="pagename current" href="#">www.donskytech.com</a>
            <a href="#">Manila</a>
            <a href="#">Philippines</a>
         </div>
      </nav>
      <button class="btn-close btn btn-sm">×</button>
      <div class="container">
         <div class="hero">
            <h1 class="title">DS18B20 MicroPython Weather Station</h1>
            <div class="graphDiv">
               <div id='temperatureGaugeDiv'>
               </div>
               <div id='temperatureLineDiv'>
               </div>
            </div>
         </div>
      </div>
   </body>
</html>
Let’s walk through the important parts.
<!DOCTYPE html>
<html>
   <head>
      <meta charset="UTF-8" />
      <meta name="viewport" content="width=device-width, initial-scale=1" />
      <title>DS18B20 Weather Station</title>
      <link rel="stylesheet" href="static/css/entireframework.min.css" />
      <link rel="stylesheet" href="static/css/index.css" />
      <!-- Load plotly.js into the DOM -->
      <script src='https://cdn.plot.ly/plotly-2.16.1.min.js'></script>
   </head>
We set the necessary meta elements here, the title of our project, and load the necessary CSS and javascript files. In addition, the Plotly.js javascript library is imported here.
   <body>
      <script src="static/js/index.js"></script>
      <nav class="nav" tabindex="-1" onclick="this.focus()">
         <div class="container">
            <a class="pagename current" href="#">www.donskytech.com</a>
            <a href="#">Manila</a>
            <a href="#">Philippines</a>
         </div>
      </nav>
      <button class="btn-close btn btn-sm">×</button>
This just displays our menu navigation at the top and a link to where I live 🙂
<div class="container">
         <div class="hero">
            <h1 class="title">DS18B20 MicroPython Weather Station</h1>
            <div class="graphDiv">
               <div id='temperatureGaugeDiv'>
               </div>
               <div id='temperatureLineDiv'>
               </div>
            </div>
         </div>
      </div>
   </body>
</html>
The HTML div elements with id temperatureGaugeDiv and temperatureLineDiv will be used as a placeholder for our graphical charts. Plotly.js will manipulate these two divs under the hood.
static/js/index.js
This file does a lot of things for our DS18B20 MicroPython project. First, it initializes our graphical charts and set the necessary configurations. Next, it calls our web server to retrieve the latest sensor readings, and lastly, it asynchronously updates our charts to reflect the latest readings.
    // Temperature Gauge Configurations
    let temperatureData = [{
    	domain: {
    		x: [0, 1],
    		y: [0, 1]
    	},
    	value: 0,
    	title: {
    		text: "Temperature"
    	},
    	type: "indicator",
    	mode: "gauge+number+delta",
    	delta: {
    		reference: 30
    	},
    	gauge: {
    		axis: {
    			range: [0, 50]
    		},
    		steps: [{
    				range: [0, 25],
    				color: "lightgray"
    			},
    			{
    				range: [25, 40],
    				color: "gray"
    			}
    		],
    		threshold: {
    			line: {
    				color: "red",
    				width: 4
    			},
    			thickness: 0.75,
    			value: 40
    		}
    	}
    }];

    // Line Chart Configurations
    let tempLineChartData = [{
    	x: [],
    	y: [],
    	type: 'scatter',
    	name: "Temperature"
    }];

    // Attach event listener when DOM content is loaded
    document.addEventListener("DOMContentLoaded", function() {


    	// Layout object that set's the size of our Gauge
    	var gaugeLayout = {
    		width: 600,
    		height: 450,
    		margin: {
    			t: 0,
    			b: 0
    		}
    	};
    	var lineLayout = {
    		width: 600,
    		height: 450,
    		margin: {
    			t: 0,
    			b: 0
    		}
    	};

    	// Create our two Graph passing in the different configurations
    	Plotly.newPlot('temperatureGaugeDiv', temperatureData, gaugeLayout);
    	Plotly.newPlot('temperatureLineDiv', tempLineChartData, lineLayout);

    });

    // Will hold the arrays we receive from our DS18B20 sensor
    let newXArray = []
    let newYArray = []
    // The maximum number of data points displayed on our scatter/line graph
    let MAX_GRAPH_POINTS = 12

    // Callback function that will retrieve our latest sensor readings and redraw our Gauge with the latest readings
    function updatePlot() {
    	fetch(`/updateValues`)
    		.then((response) => response.json())
    		.then(data => {
    			console.log(data)
    			var newReading = data.reading
    			var temp_update = {
    				value: newReading
    			};

    			if (newXArray.length > MAX_GRAPH_POINTS) {
    				newXArray.shift()
    			}

    			if (newYArray.length > MAX_GRAPH_POINTS) {
    				newYArray.shift()
    			}


    			newXArray.push(new Date().toLocaleTimeString());
    			newYArray.push(newReading);

    			var data_update = {
    				'x': [newXArray],
    				'y': [newYArray]
    			};

    			console.log(data_update)
    			Plotly.update('temperatureGaugeDiv', temp_update);
    			Plotly.update('temperatureLineDiv', data_update);

    		})
    }

    // Continuos loop that runs evry 3 seconds to update our web page with the latest sensor readings
    (function loop() {
    	setTimeout(() => {
    		updatePlot()
    		loop();
    	}, 3000);
    })();
// Temperature Gauge Configurations
let temperatureData = [{
domain: {
x: [0, 1],
y: [0, 1]
},
value: 0,
title: {
text: "Temperature"
},
type: "indicator",
mode: "gauge+number+delta",
delta: {
reference: 30
},
gauge: {
axis: {
range: [0, 50]
},
steps: [{
range: [0, 25],
color: "lightgray"
},
{
range: [25, 40],
color: "gray"
}
],
threshold: {
line: {
color: "red",
width: 4
},
thickness: 0.75,
value: 40
}
}
}];
// Line Chart Configurations
let tempLineChartData = [{
x: [],
y: [],
type: 'scatter',
name: "Temperature"
}];The temperatureData and tempLineChartData variables hold the configuration of our Plotly.js graph. More details about how to configure the Plotly.js gauge chart can be found here.
    // Attach event listener when DOM content is loaded
    document.addEventListener("DOMContentLoaded", function() {


    	// Layout object that set's the size of our Gauge
    	var gaugeLayout = {
    		width: 600,
    		height: 450,
    		margin: {
    			t: 0,
    			b: 0
    		}
    	};
    	var lineLayout = {
    		width: 600,
    		height: 450,
    		margin: {
    			t: 0,
    			b: 0
    		}
    	};

    	// Create our two Graph passing in the different configurations
    	Plotly.newPlot('temperatureGaugeDiv', temperatureData, gaugeLayout);
    	Plotly.newPlot('temperatureLineDiv', tempLineChartData, lineLayout);

    });
We add an event listener when our HTML DOM content is loaded and we initialize the layout of our two charts. We then create the chart by calling the method Plotly.newPlot().
    // Will hold the arrays we receive from our DS18B20 sensor
    let newXArray = []
    let newYArray = []
    // The maximum number of data points displayed on our scatter/line graph
    let MAX_GRAPH_POINTS = 12
The variables newXArray and newYArray will contain the latest retrieved sensor readings and the date of the readings. The max number of readings to be displayed in our line chart is 12 as set by the variable MAX_GRAPH_POINTS
    // Callback function that will retrieve our latest sensor readings and redraw our Gauge with the latest readings
    function updatePlot() {
    	fetch(`/updateValues`)
    		.then((response) => response.json())
    		.then(data => {
    			console.log(data)
    			var newReading = data.reading
    			var temp_update = {
    				value: newReading
    			};

    			if (newXArray.length > MAX_GRAPH_POINTS) {
    				newXArray.shift()
    			}

    			if (newYArray.length > MAX_GRAPH_POINTS) {
    				newYArray.shift()
    			}


    			newXArray.push(new Date().toLocaleTimeString());
    			newYArray.push(newReading);

    			var data_update = {
    				'x': [newXArray],
    				'y': [newYArray]
    			};


    			console.log(data_update)
    			Plotly.update('temperatureGaugeDiv', temp_update);
    			Plotly.update('temperatureLineDiv', data_update);

    		})
    }
The updatePlot() is a function that will call the “/updateValues” route of our MicroDot web server. It then extracts the returned HTTP response and checks if we exceed the max limit of 12. If it is, then we remove the first record in our arrays newXArray and newYArray
We then push the latest sensor reading into the said array variables. The temp_update and data_update variables are then used to update our two charts with the latest values.
    // Continuos loop that runs evry 3 seconds to update our web page with the latest sensor readings
    (function loop() {
    	setTimeout(() => {
    		updatePlot()
    		loop();
    	}, 3000);
    })();
This is our loop that will be called every 3 seconds and it calls our updatePlot() function. It will continually request for latest DS18B20 readings from our MicroPython web server.
microdot-*
Files that start with microdot are MicroDot-specific files. I have them copied from the project GitHub repository.
static/css/index.css
This is the CSS file that will style our index.html and its main job is to set the alignment of our graphs.
# * {
#   box-sizing: border-box;
# }

/******** mincss **********/
.hero {
    background: #eee;
    padding: 20px;
    border-radius: 10px;
    margin-top: 1em;
    text-align: center;

}

.hero h1 {
    margin-top: 0;
    margin-bottom: 0.3em;
    color: red;
}


/****************

****************/
.graphDiv{
    display: flex;
    flex-wrap: wrap;
    text-align:center;
}

.graphDiv>div{
  flex: 50%;
  text-align: center;
}

/* Responsive layout - makes a one column-layout instead of a two-column layout */
@media (max-width: 800px) {
  .graphDiv>div {
    flex: 100%;
  }
}
static/css/entireframework.min.css
The file entireframework.min.css is the mincss CSS framework. I used this library most of the time because it is only a few kilobytes which is ideal for microcontrollers which is storage hungry! You can find more info on how it works by visiting its example page.
We have discussed all files involved in our DS18B20 MicroPython Weather station project. It contains a lot of code but you can inspect them one by one to learn more about it.
How to deploy the project to your MicroPython Device?
First, connect your MicroPython device to your Thonny IDE and make sure that it is detected by your laptop or workstation.
Next, open the boot.py file and change the credentials to match those of your Wifi network.
Next, install the uTemplate library on your MicroPython device. If you are unsure how this is done then you can follow my How to install MicroPython libraries or packages in Thonny IDE?
Lastly, upload all the files to your MicroPython device
Soft reboot your MicroPython device and wait for the following messages to be displayed.
MPY: soft reboot
Connecting to your wifi...
Connected! Network config: ('192.168.100.36', '255.255.255.0', '192.168.100.1', '192.168.100.1')
Take note of the IP Address and then open the browser on your mobile phone and type in the following URL.
http://<IP-Address>:5000This should open up the web application in your browser.
Wrap Up
We have explored how to interface with DS18B20 using our MicroPython device in this post. Initially, we used the out-of-the-box support of MicroPython for 1-Wire devices such as this sensor and then expand it with our very own weather station project.
The code might be long and daunting at first but you would learn more from it by playing around with it. If something is not clear or confusing then please log a comment on this post and I will try my best to help you.
I hope you have learned something. Happy exploring!
Read Next:
Raspberry Pi Pico W: BME280 Weather Station Dashboard
Using Arduino with BME280 plus a weather station project
Leave a Reply