Introduction
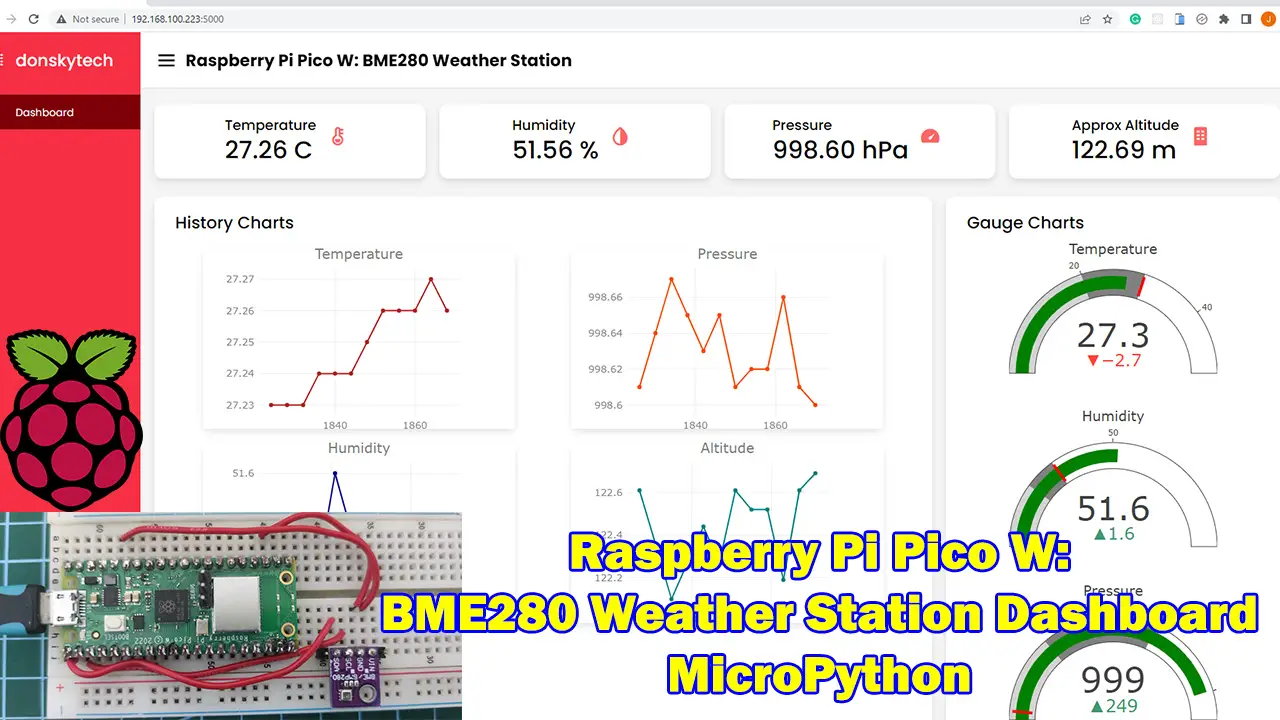
This post will show you how to interface your Raspberry Pi Pico W with the BMP280/BME280 sensor to retrieve Temperature, Humidity, Pressure, and Relative Altitude. At the end of this post, we will create a beautiful weather station dashboard that will display the sensor readings in colorful text and charts using MicroPython.
If you want to see this project in a video format then please see below. You can also watch this on my YouTube channel.
Prerequisites
The component list below shows the components needed in order to follow along with this post.
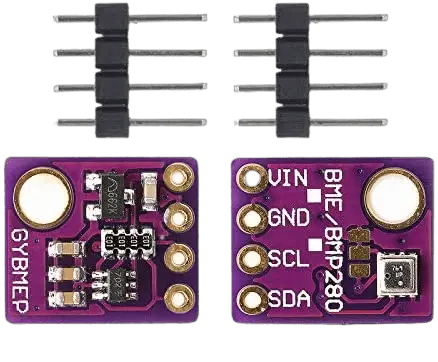
- BMP280/BME280 Temperature sensor (I used BME280 ) – Amazon | AliExpress
- Raspberry Pi Pico W – Amazon | AliExpress
- Breadboard – Amazon | AliExpress | Bangood
- Jumper wires – Amazon | AliExpress | Bangood
Disclosure: These are affiliate links and I will earn small commissions to support my site when you buy through these links.
I am using the awesome Thonny IDE in developing this project as this will help you greatly in the development process. If you are unfamiliar with how to use Thonny IDE, please take a look at my earlier post about how to get started using this IDE.
Related Content:
MicroPython Development Using Thonny IDE
You should have installed the latest MicroPython firmware for your Raspberry Pi Pico.
Related Content:
How to Install MicroPython firmware on Raspberry Pi Pico?
What is BME280/BMP280?
The BME280 is a humidity sensor especially developed for mobile applications and wearables where size and low power consumption are key design parameters. The unit combines high linearity and high accuracy sensors and is perfectly feasible for low current consumption, long-term stability and high EMC robustness. The humidity sensor offers an extremely fast response time and therefore supports performance requirements for emerging applications such as context awareness, and high accuracy over a wide temperature range.
bosch
Bosch developed the BME280 sensor which is capable of providing the following information with high accuracy.
- Temperature
- Humidity
- Pressure
- Altitude
The complete datasheet can be found here but the important specifications are listed below.
| Temperature | -40 to +85 °Celcius (+/- 1°C) |
| Humidity | 0% to 100% RH (+/- 3%) |
| Pressure | 300Pa to 1100hPa (+/- 1 hPa) |
| Altitude | 0 to 30,000 ft (+/- 1 m) |
| Operating Voltage | 3-5 V |
Note: The BMP280/BME280 sensor can also function as an altimeter as the pressure changes with altitude but for the altitude to be accurate then you need to know the pressure at sea level so you can use this as a baseline.
Pinout
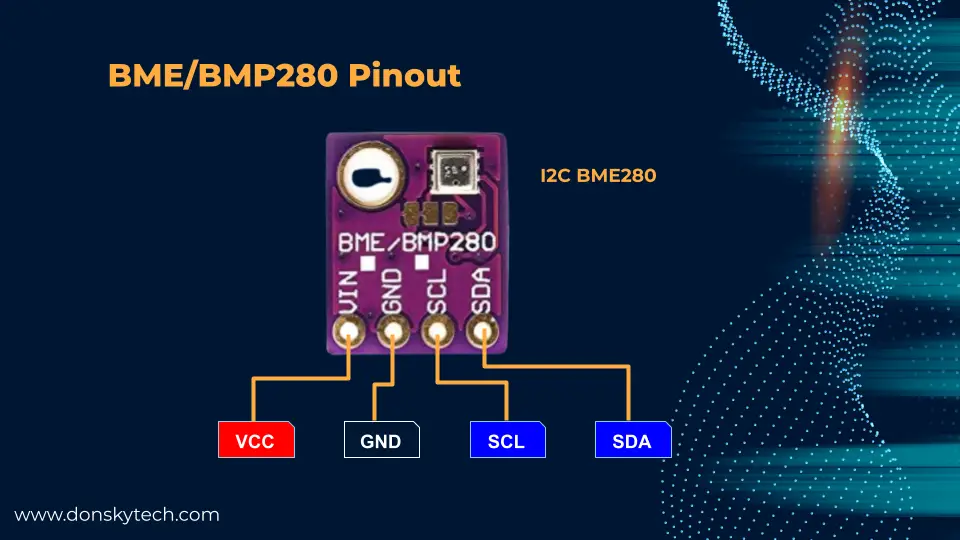
I am using a BME280 module that uses the I2C as its communication protocol so the standard SDA/SCL pins are available together with the power pins VCC/GND.
Schematic/Wiring
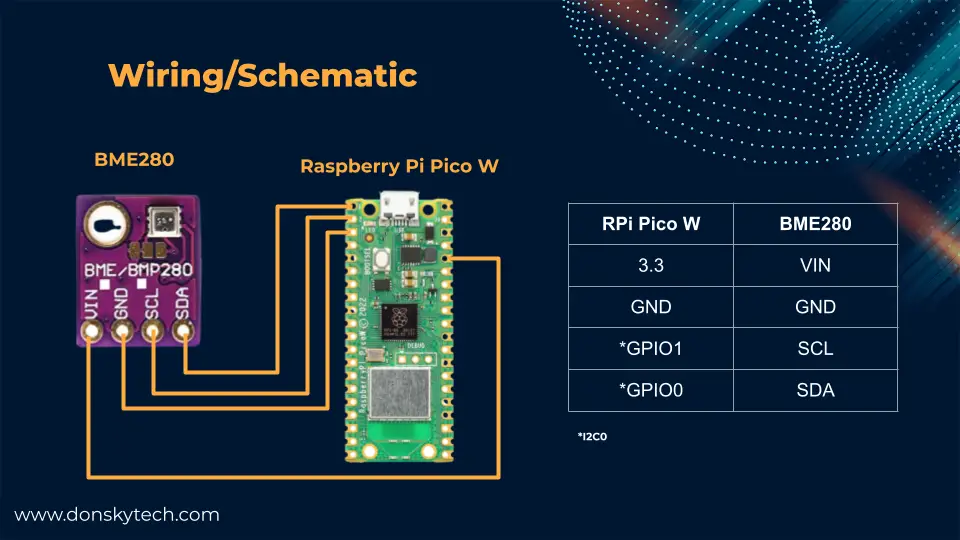
The image above is the wiring diagram between our Raspberry Pi Pico W microcontroller with the BMP280/BME280 sensor. We are using the I2C (zero) channel of our microcontroller in communicating with the BMP280/BME280 sensor.
If your module is using the SPI pins then that would be a different wiring with a different set of pins.
How to program the BMP280/BME280 sensor with MicroPython?
Install the BME280 library
Install the micropython-bme280 as we will use this library in driving our BME280 sensor.
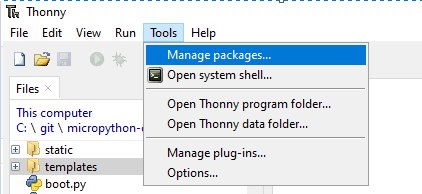
Click the Tools then Manage Packages in Thonny IDE
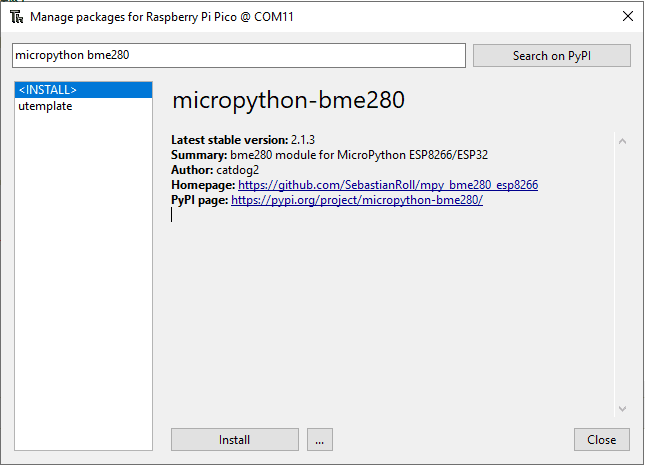
In the search field, type in “Micropython bme280” then click the micropython-bme280 then click the Install button. Wait for the installation to finish before proceeding.
Example MicroPython Code to read BME280 sensor
Below is the sample code on how to read the BME280 sensor values.
import machine
import bme280

i2c = machine.I2C(id=0, scl=machine.Pin(1), sda=machine.Pin(0))
bme = bme280.BME280(i2c=i2c)

print(bme.values)
Let us go through what each line of code does.
import machine
import bme280
Import the necessary package to drive the BME280 temperature sensor.
i2c = machine.I2C(id=0, scl=machine.Pin(1), sda=machine.Pin(0))
bme = bme280.BME280(i2c=i2c)

print(bme.values)
We define an instance of the I2C class passing in the id=0 and the SCL and SDA pins that will be used for communicating with the sensor.
Next, we created a class BME280 passing in the I2C object that we created earlier.
Lastly, we call the bme.values to retrieve the temperature, humidity, and pressure values. This will print the following values on our Thonny Shell.
>>> %Run -c $EDITOR_CONTENT
('26.6C', '1001.95hPa', '50.80%')
Raspberry Pi Pico W BMP280/BME280 Weather Station Project
We are building our custom Raspberry Pi Pico W powered BME280/BMP280 weather station project with a beautiful dashboard that was inspired by the following post.
Note: I have developed this application on a wide-screen monitor with a resolution of 1366 x 768 so the user interface might vary for smaller resolutions. I did not bother to test this in a mobile environment like your phone. The code would become bigger to compensate for mobile environments so I just simplified it.
BME280 Weather Station Dashboard Parts
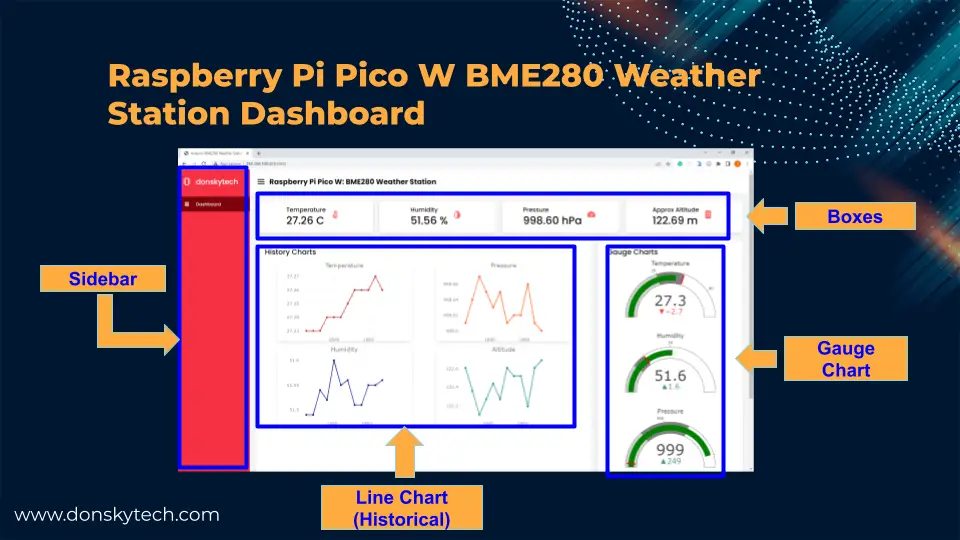
The above image is the parts of our Raspberry Pi Pico W BMP280/BME280 Weather station dashboard and it includes the following:
- Sidebar – displays the dashboard link and my project name
- Boxes – displays the BME280 sensor readings in text format
- Line Chart – displays the historical sensor reading records
- Gauge Chart – displays the sensor readings in a beautiful gauge chart format
All parts above are referenced in the code so I have listed them here.
Design
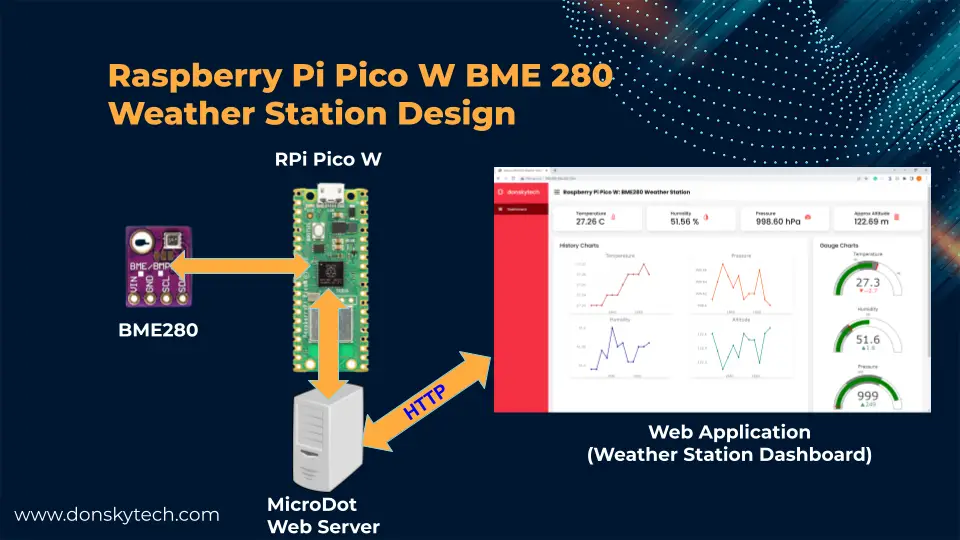
The image above is the overall design of our Raspberry Pi Pico W BMP/BME280 weather station dashboard.
We have created a MicroDot web server inside our Raspberry Pi Pico W board that will open up our web application and they both communicate thru HTTP. The Weather station dashboard is requesting for sensor readings every three seconds and it asynchronously updates its user interface. Please see the links below if you are not familiar with what MicroDot is and how to get started.
Related Content:
Develop MicroPython Application using MicroDot
How to create a MicroPython Web Server the easy way!
When the Microdot web server receives the request then it asks for sensor reading values from the BME280 sensor. The web server is written in MicroPython code while the web application is a mixture of HTML/CSS/Javascript.
Code
The complete code for this project is in my GitHub account and you can either download it as a zip file or if you know Git then you can clone it using this command.
git clone https://github.com/donskytech/rpi-pico-w-bme280-weather-station.git
cd rpi-pico-w-bme280-weather-station
Open this with Thonny IDE when the download or cloning is finished.
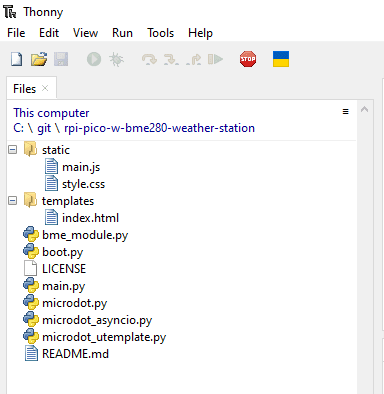
The following files are the important parts of this project and the following are its role.
- bme_module.py – this contains the module that will communicate with our BME280 sensor.
- boot.py – connects to our Wifi network when our Raspberry Pi Pico W is restarted
- main.py – contains the MicroDot web server code that handles the HTTP connections with our browser.
- index.html – contains the HTML markup of our weather station project
- style.css – stylizes the content of our HTML page
- main.js – handles the logic of updating the values read from the sensor and displays the readings in graphical charts.
- microdot* – microdot specific files and extensions
We will discuss each file in the next section and I will try my best to explain to you what each line of code does.
Libraries used in this project
I am using the following libraries in building this project:
- uTemplate – used by MicroDot for the templating engine
- micropython-bme280 – used to communicate our MicroPython code with the BME280 sensor.
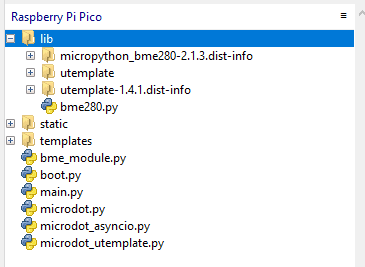
Install the two libraries using Thonny IDE and if you are not familiar with how this is done then you can see the following How to install MicroPython libraries or packages in Thonny IDE?
bme_module.py
The bme_module.py contains the class that communicates with our BME280 sensor and below is its code.
import machine
import bme280
import math

class BME280Module:
    SEA_LEVEL_PRESSURE_HPA = 1013.25
    def __init__(self, id, scl_pin, sda_pin):
        self.i2c = machine.I2C(id=id, scl=machine.Pin(scl_pin), sda=machine.Pin(sda_pin), freq=400000)
        self.bme = bme280.BME280(i2c=self.i2c)

    def get_sensor_readings(self):
        (temperature, pressure, humidity) = self.bme.values
        temperature_val = float(temperature[:len(temperature) - 1])
        humidity_val = float(humidity[:len(humidity) - 1])
        pressure_val = float(pressure[:len(pressure) - 3])

        # Altitude calculation
        altitude_val = 44330 * (1.0 - math.pow(pressure_val / BME280Module.SEA_LEVEL_PRESSURE_HPA, 0.1903))

        return (temperature_val, pressure_val, humidity_val, altitude_val)
Let’s scan what each line of code does.
import machine
import bme280
import math
Import the necessary packages in order to communicate with our BME280 using our Raspberry Pi Pico W.
class BME280Module:
    SEA_LEVEL_PRESSURE_HPA = 1013.25
We declare a class BME280Module that would represent our interface to the BME280 sensor. Also, we defined a class constant that represents the sea level pressure which we will be using later to approximate our relative altitude.
    def __init__(self, id, scl_pin, sda_pin):
        self.i2c = machine.I2C(id=id, scl=machine.Pin(scl_pin), sda=machine.Pin(sda_pin), freq=400000)
        self.bme = bme280.BME280(i2c=self.i2c)
This is our class constructor that initializes our object and it requires the following parameter:
- id – represents the I2C channel
- scl_pin – the assigned SCL GPIO pin for I2C communication
- sda_pin – the assigned SDA GPIO pin for I2C communication
We then create an instance of the I2C class by passing in the three parameters above.
Next, we initialize an instance of the BME280 class by passing the I2C object that we created earlier.
    def get_sensor_readings(self):
        (temperature, pressure, humidity) = self.bme.values
        temperature_val = float(temperature[:len(temperature) - 1])
        humidity_val = float(humidity[:len(humidity) - 1])
        pressure_val = float(pressure[:len(pressure) - 3])

        # Altitude calculation
        altitude_val = 44330 * (1.0 - math.pow(pressure_val / BME280Module.SEA_LEVEL_PRESSURE_HPA, 0.1903))

        return (temperature_val, pressure_val, humidity_val, altitude_val)
We declare the get_sensor_readings() method that we can call to retrieve the readings from our BME280 sensor.
When calling the bme.values property, it then returns the value with the unit of measurement like below so we first extract the numeric value by using string indexing in Python and convert everything to float.
('26.6C', '1001.95hPa', '50.80%')The altitude_val is computed by passing in the sea pressure level at the current time of the day and using the above math formula from Adafruit.
It then returns a Python tuple of all the values back to the calling client.
boot.py
# boot.py -- run on boot-up
import network, utime

# Replace the following with your WIFI Credentials
SSID = "<PLACE_YOUR_SSID_HERE>"
SSI_PASSWORD = "<PLACE_YOUR_WIFI_PASWORD_HERE>"

def do_connect():
    import network
    sta_if = network.WLAN(network.STA_IF)
    if not sta_if.isconnected():
        print('connecting to network...')
        sta_if.active(True)
        sta_if.connect(SSID, SSI_PASSWORD)
        while not sta_if.isconnected():
            pass
    print('Connected! Network config:', sta_if.ifconfig())

print("Connecting to your wifi...")
do_connect()
The above code is our MicroPython code that connects to our Wifi network when the Raspberry Pi Pico W is restarted or upon boot up. Let us go through what each line of code does.
# boot.py -- run on boot-up
import network, utime

# Replace the following with your WIFI Credentials
SSID = "<PLACE_YOUR_SSID_HERE>"
SSI_PASSWORD = "<PLACE_YOUR_WIFI_PASWORD_HERE>"
Import necessary packages to communicate with our Wifi network. Replace the following with your Wifi network credentials.
def do_connect():
    import network
    sta_if = network.WLAN(network.STA_IF)
    if not sta_if.isconnected():
        print('connecting to network...')
        sta_if.active(True)
        sta_if.connect(SSID, SSI_PASSWORD)
        while not sta_if.isconnected():
            pass
    print('Connected! Network config:', sta_if.ifconfig())

print("Connecting to your wifi...")
do_connect()
The code above will attempt to communicate with your Wifi network until it is able to connect successfully and then it will print the IP Address accordingly.
Connecting to your wifi...
Connected! Network config: ('192.168.100.223', '255.255.255.0', '192.168.100.1', '192.168.100.1')
If everything is successful then it should be able to print the message above. Make sure to take note of the assigned IP address to our Raspberry Pi Pico W as we will be using it later.
main.py
Below is the code for our main.py file which is the file responsible for the creation of our MicroDot web server.
from microdot_asyncio import Microdot, Response, send_file
from microdot_utemplate import render_template
from bme_module import BME280Module

I2C_ID = 0
SCL_PIN = 1
SDA_PIN = 0

app = Microdot()
Response.default_content_type = "text/html"

bme_module = BME280Module(I2C_ID,SCL_PIN,SDA_PIN)

# index.html root route
@app.route("/")
async def index(request):
    return render_template("index.html")

# Read sensor readings and return as JSON
@app.route("/sensorReadings")
async def get_sensor_readings(request):
    temperature, pressure, humidity, altitude = bme_module.get_sensor_readings()
    sensor_readings = {"status": "OK", "temperature": temperature, "pressure": pressure, "humidity": humidity, "altitude": altitude}
    return sensor_readings

# Shutdown the application
@app.route("/shutdown")
async def shutdown(request):
    request.app.shutdown()
    return "The server is shutting down..."

# Static CSS/JSS
@app.route("/static/<path:path>")
def static(request, path):
    if ".." in path:
        # directory traversal is not allowed
        return "Not found", 404
    return send_file("static/" + path)


if __name__ == "__main__":
    try:
        app.run()
    except KeyboardInterrupt:
        pass
Let us go over what each line of code does.
from microdot_asyncio import Microdot, Response, send_file
from microdot_utemplate import render_template
from bme_module import BME280Module
Import the necessary MicroDot-specific file and include our BME280Module class.
I2C_ID = 0
SCL_PIN = 1
SDA_PIN = 0
Create constants for our GPIO pins and I2C channel
app = Microdot()
Response.default_content_type = "text/html"

bme_module = BME280Module(I2C_ID,SCL_PIN,SDA_PIN)
Make an instance of the MicroDot application and set the default content type to “text/html”. Also, we initialize an instance of our BME280Module here passing in our constants.
# index.html root route
@app.route("/")
async def index(request):
    return render_template("index.html")
This MicroDot route will serve as an instance of our index.html page and will serve as the root of our application.
# Read sensor readings and return as JSON
@app.route("/sensorReadings")
async def get_sensor_readings(request):
    temperature, pressure, humidity, altitude = bme_module.get_sensor_readings()
    sensor_readings = {"status": "OK", "temperature": temperature, "pressure": pressure, "humidity": humidity, "altitude": altitude}
    return sensor_readings
The “/sensorReadings” will retrieve the current BME280 sensor readings and return it in JSON format to our caller which in this case is our Weather Station Dashboard.
# Shutdown the application
@app.route("/shutdown")
async def shutdown(request):
    request.app.shutdown()
    return "The server is shutting down..."

# Static CSS/JSS
@app.route("/static/<path:path>")
def static(request, path):
    if ".." in path:
        # directory traversal is not allowed
        return "Not found", 404
    return send_file("static/" + path)
The “/shutdown” route will shut down our MicroDot app from our browser while the “/static/<path:path>” is used to serve the HTML/CSS/Javascript files of our project.
if __name__ == "__main__":
    try:
        app.run()
    except KeyboardInterrupt:
        pass
This will run our MicroDot web server application.
microdot.py, microdot_asyncio.py, and microdot_utemplate.py
These are MicroDot-specific files and extensions that I have used for the web server application. They are taken directly from the MicroDot GitHub source repository.
index.html
Below is the code for our index.html which will display the sensor readings in both text and chart format.
<!DOCTYPE html>
<html lang="en">
  <head>
    <meta charset="UTF-8" />
    <meta name="viewport" content="width=device-width, initial-scale=1.0" />
    <meta http-equiv="X-UA-Compatible" content="ie=edge" />
    <title>Raspberry Pi Pico W BME280 Weather Station</title>
    <link
      href="https://unpkg.com/boxicons@2.0.7/css/boxicons.min.css"
      rel="stylesheet"
    />
    <link rel="stylesheet" href="static/style.css" />
    <script src="https://cdn.plot.ly/plotly-2.16.1.min.js"></script>
  </head>
  <body>
    <div class="sidebar">
      <div class="logo-details">
        <i class='bx bx-microchip'></i>
        <span class="logo_name">donskytech</span>
      </div>
      <ul class="nav-links">
        <li>
          <a href="#" class="active">
            <i class="bx bx-grid-alt"></i>
            <span class="links_name">Dashboard</span>
          </a>
        </li>
      </ul>
    </div>
    <section class="home-section">
      <nav>
        <div class="sidebar-button">
          <i class="bx bx-menu sidebarBtn"></i>
          <span class="dashboard">Raspberry Pi Pico W: BME280 Weather Station</span>
        </div>
      </nav>
      <div class="home-content">
        <div class="overview-boxes">
          <div class="box">
            <div class="right-side">
              <div class="box-topic">Temperature</div>
              <div class="number" id="temperature"></div>
            </div>
            <i class="bx bxs-thermometer readings"></i>
          </div>
          <div class="box">
            <div class="right-side">
              <div class="box-topic">Humidity</div>
              <div class="number" id="humidity"></div>
            </div>
            <i class="bx bxs-droplet-half readings two"></i>
          </div>
          <div class="box">
            <div class="right-side">
              <div class="box-topic">Pressure</div>
              <div class="number" id="pressure"></div>
            </div>
            <i class="bx bxs-tachometer readings three"></i>
          </div>
          <div class="box">
            <div class="right-side">
              <div class="box-topic">Approx Altitude</div>
              <div class="number" id="altitude"></div>
            </div>
            <i class="bx bxs-building readings four"></i>
          </div>
        </div>
        <div class="graph-box">
          <div class="history-charts">
            <div class="title">History Charts</div>
            <div class="history-details">
              <div class="history-col-item">
                <div id="temperature-history" class="history-divs"></div>
                <div id="humidity-history" class="history-divs"></div>
              </div>
              <div class="history-col-item">
                <div id="pressure-history" class="history-divs"></div>
                <div id="altitude-history" class="history-divs"></div>
              </div>
            </div>
          </div>
          <div class="gaugeCharts">
            <div class="title">Gauge Charts</div>
            <div class="gauge-list">
              <div class="gauge-box"><div id="temperature-gauge"></div></div>
              <div class="gauge-box"><div id="humidity-gauge"></div></div>
              <div class="gauge-box"><div id="pressure-gauge"></div></div>
              <div class="gauge-box"><div id="altitude-gauge"></div></div>
            </div>
          </div>
        </div>
      </div>
    </section>
    <script src="static/main.js"></script>
  </body>
</html>
<!DOCTYPE html>
<html lang="en">
<head>
<meta charset="UTF-8" />
<meta name="viewport" content="width=device-width, initial-scale=1.0" />
<meta http-equiv="X-UA-Compatible" content="ie=edge" />
<title>Raspberry Pi Pico W BME280 Weather Station</title>
<link
href="https://unpkg.com/boxicons@2.0.7/css/boxicons.min.css"
rel="stylesheet"
/>
<link rel="stylesheet" href="static/style.css" />
<script src="https://cdn.plot.ly/plotly-2.16.1.min.js"></script>
</head>We set the meta tags for our page and import the necessary CSS and javascript files. In addition, we are using boxicons to display the different icons used in our project.
  <body>
    <div class="sidebar">
      <div class="logo-details">
        <i class='bx bx-microchip'></i>
        <span class="logo_name">donskytech</span>
      </div>
      <ul class="nav-links">
        <li>
          <a href="#" class="active">
            <i class="bx bx-grid-alt"></i>
            <span class="links_name">Dashboard</span>
          </a>
        </li>
      </ul>
    </div>
The sidebar is where we display my soon-to-be popular name (donskytech hahaha! :))
<section class="home-section">
<nav>
<div class="sidebar-button">
<i class="bx bx-menu sidebarBtn"></i>
<span class="dashboard">Raspberry Pi Pico W: BME280 Weather Station</span>
</div>
</nav>
<div class="home-content">
<div class="overview-boxes">
<div class="box">
<div class="right-side">
<div class="box-topic">Temperature</div>
<div class="number" id="temperature"></div>
</div>
<i class="bx bxs-thermometer readings"></i>
</div>
<div class="box">
<div class="right-side">
<div class="box-topic">Humidity</div>
<div class="number" id="humidity"></div>
</div>
<i class="bx bxs-droplet-half readings two"></i>
</div>
<div class="box">
<div class="right-side">
<div class="box-topic">Pressure</div>
<div class="number" id="pressure"></div>
</div>
<i class="bx bxs-tachometer readings three"></i>
</div>
<div class="box">
<div class="right-side">
<div class="box-topic">Approx Altitude</div>
<div class="number" id="altitude"></div>
</div>
<i class="bx bxs-building readings four"></i>
</div>
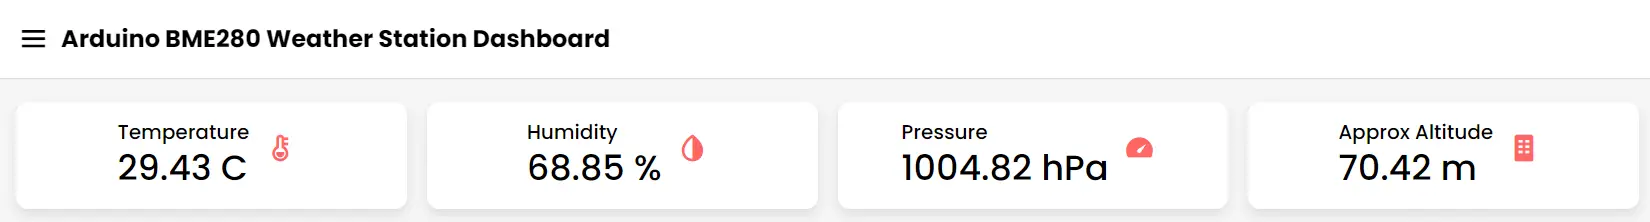
</div>The “home-section” class is where we create the HTML elements for displaying the sensor readings in both text and graph format. The above HTML code will display the top section of our dashboard page.
<div class="graph-box">
<div class="history-charts">
<div class="title">History Charts</div>
<div class="history-details">
<div class="history-col-item">
<div id="temperature-history" class="history-divs"></div>
<div id="humidity-history" class="history-divs"></div>
</div>
<div class="history-col-item">
<div id="pressure-history" class="history-divs"></div>
<div id="altitude-history" class="history-divs"></div>
</div>
</div>
</div>
<div class="gaugeCharts">
<div class="title">Gauge Charts</div>
<div class="gauge-list">
<div class="gauge-box"><div id="temperature-gauge"></div></div>
<div class="gauge-box"><div id="humidity-gauge"></div></div>
<div class="gauge-box"><div id="pressure-gauge"></div></div>
<div class="gauge-box"><div id="altitude-gauge"></div></div>
</div>
</div>
</div>
</div>
</section>
<script src="main.js"></script>
</body>
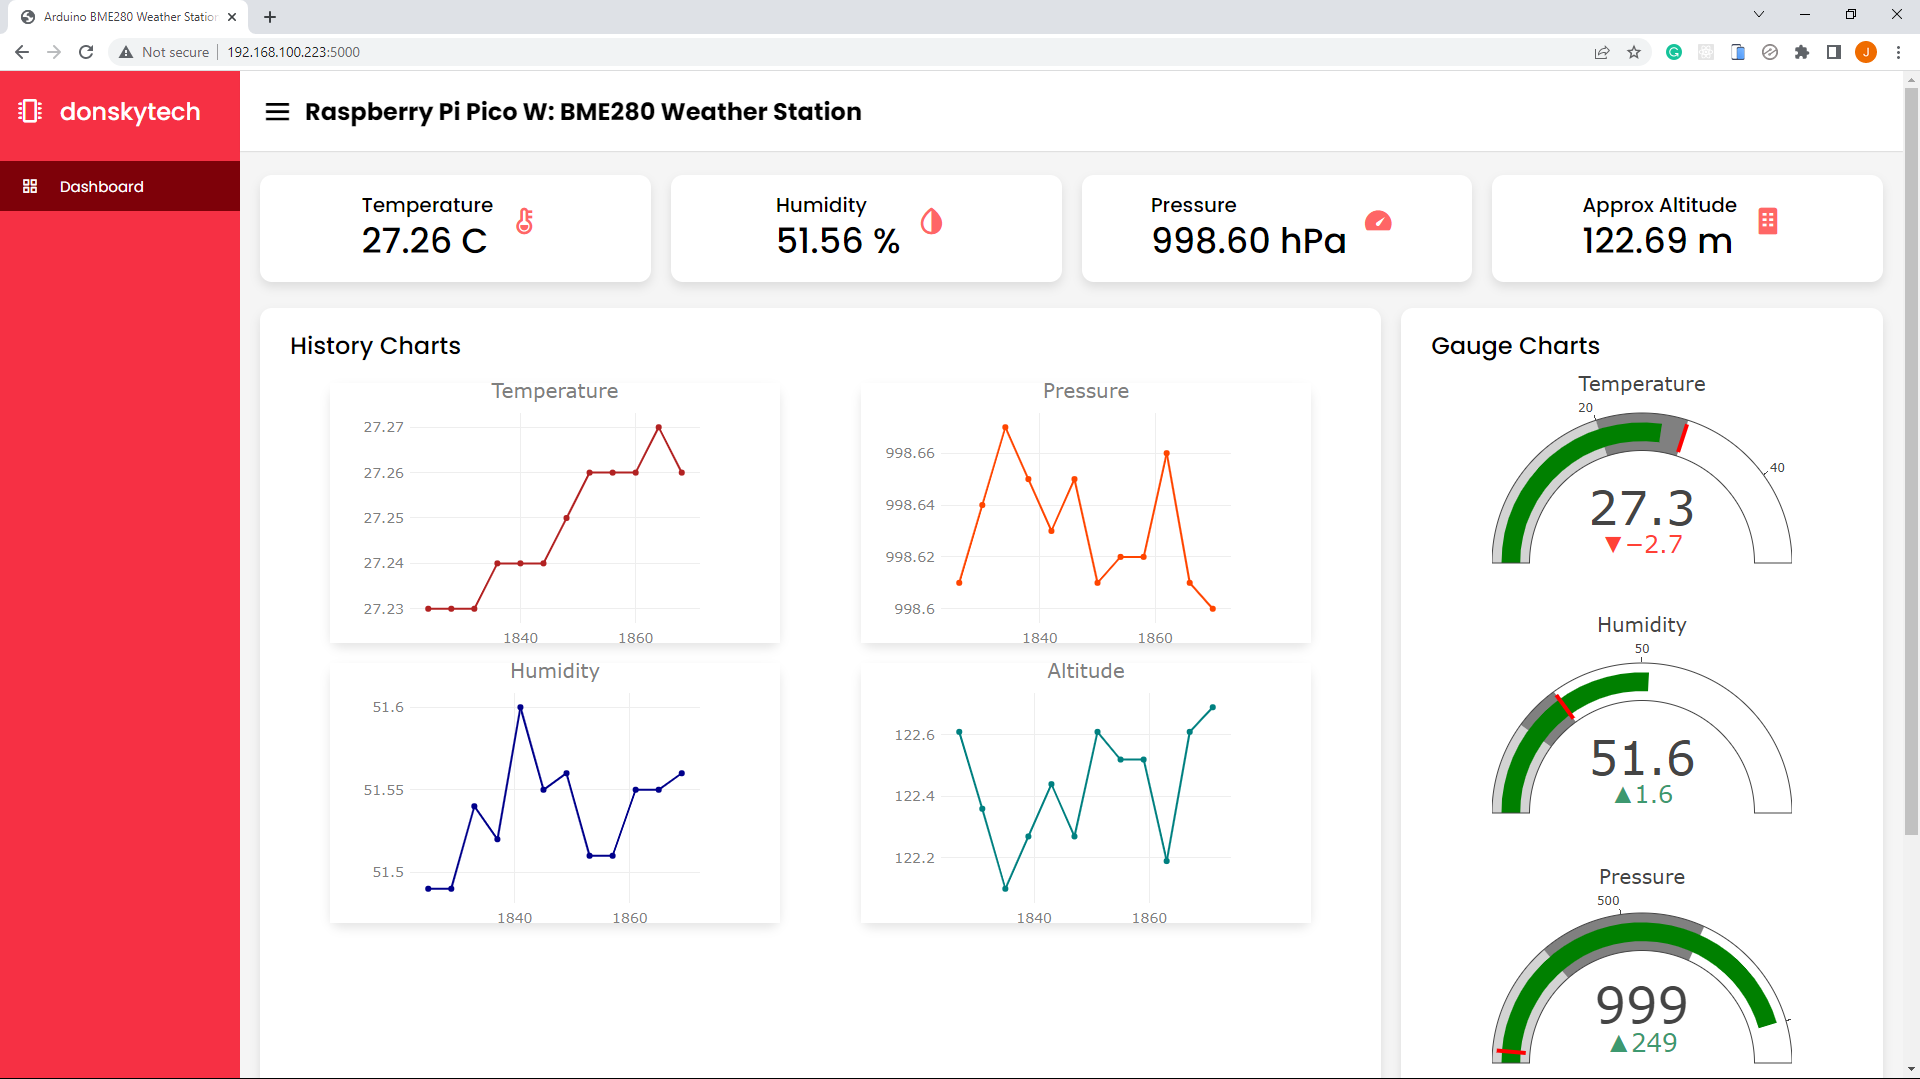
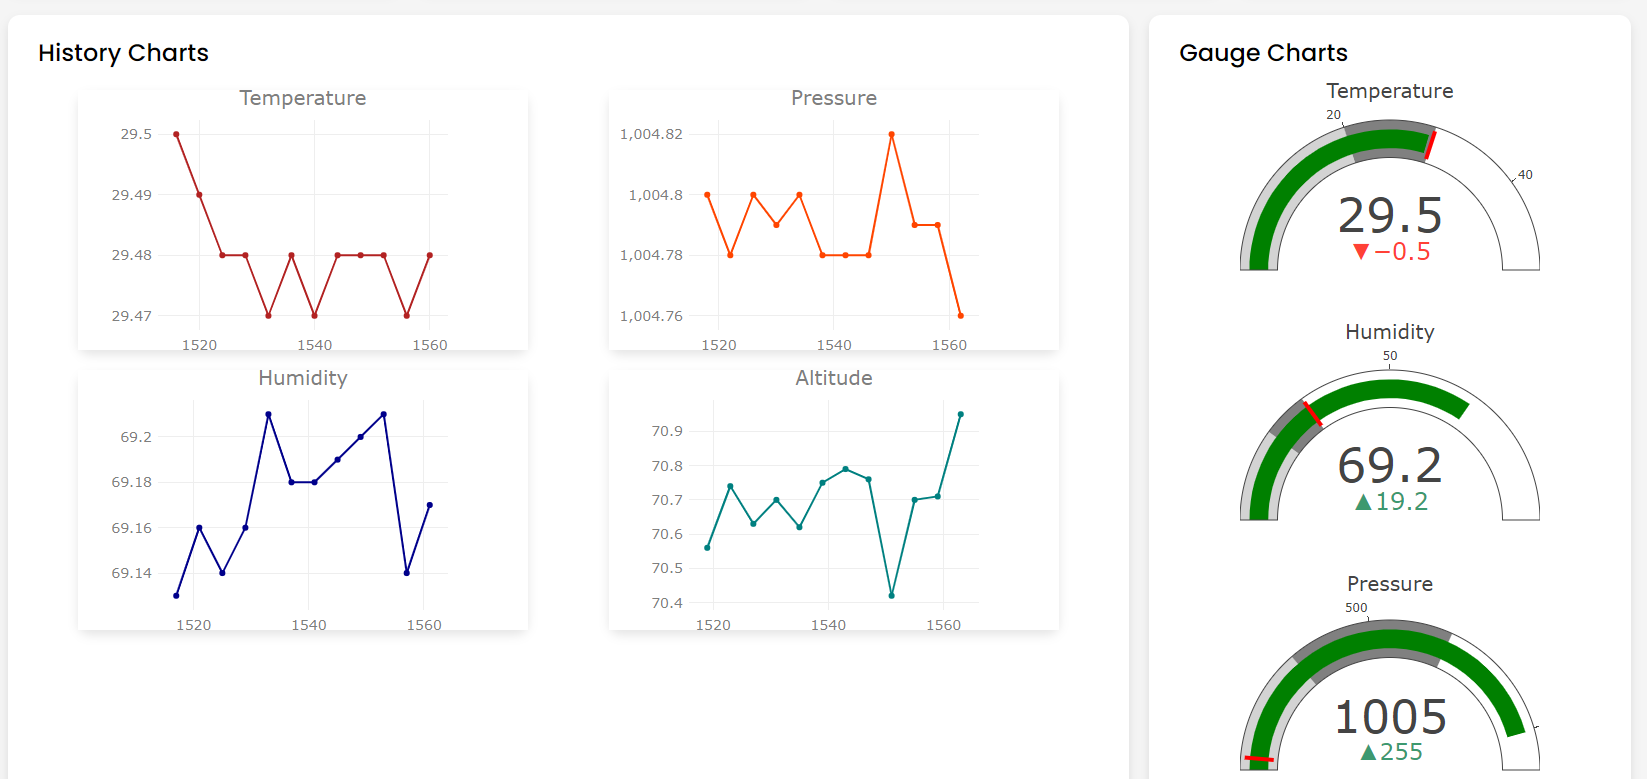
</html>The above code will display the graph charts of our sensor readings. It only contains div elements as this will be populated by the Plotly.js javascript charting library. The HTML elements above will display the following user interface.
style.css
The style.css will stylize or beautify our index.html thru Cascading Style Sheets classes. I won’t be discussing so much about how these CSS style classes work but I would suggest that you comment on each line one by one and see how it impacts our index.html page.
/* Googlefont Poppins CDN Link */
@import url('https://fonts.googleapis.com/css2?family=Poppins:wght@200;300;400;500;600;700&display=swap');

*{
  margin: 0;
  padding: 0;
  box-sizing: border-box;
  font-family: 'Poppins', sans-serif;
}

.sidebar{
  position: fixed;
  height: 100%;
  width: 240px;
  background: #f63044;
  transition: all 0.5s ease;
}

.sidebar.active{
  width: 60px;
}

.sidebar .logo-details{
  height: 80px;
  display: flex;
  align-items: center;
}

.sidebar .logo-details i{
  font-size: 28px;
  font-weight: 500;
  color: #fff;
  min-width: 60px;
  text-align: center
}
.sidebar .logo-details .logo_name{
  color: #fff;
  font-size: 24px;
  font-weight: 500;
}
.sidebar .nav-links{
  margin-top: 10px;
}

.sidebar .nav-links li{
  position: relative;
  list-style: none;
  height: 50px;
}
.sidebar .nav-links li a{
  height: 100%;
  width: 100%;
  display: flex;
  align-items: center;
  text-decoration: none;
  transition: all 0.4s ease;
}
.sidebar .nav-links li a.active{
  background: #7e0109;
}
.sidebar .nav-links li a:hover{
  background: #eff1f3;
}
.sidebar .nav-links li i{
  min-width: 60px;
  text-align: center;
  font-size: 18px;
  color: #fff;
}
.sidebar .nav-links li a .links_name{
  color: #fff;
  font-size: 15px;
  font-weight: 400;
  white-space: nowrap;
}

.home-section{
  position: relative;
  background: #f5f5f5;
  min-height: 100vh;
  width: calc(100% - 240px);
  left: 240px;
  transition: all 0.5s ease;
}
.sidebar.active ~ .home-section{
  width: calc(100% - 60px);
  left: 60px;
}
.home-section nav{
  display: flex;
  justify-content: space-between;
  height: 80px;
  background: #fff;
  display: flex;
  align-items: center;
  position: fixed;
  width: calc(100% - 240px);
  left: 240px;
  z-index: 100;
  padding: 0 20px;
  box-shadow: 0 1px 1px rgba(0, 0, 0, 0.1);
  transition: all 0.5s ease;
}
.sidebar.active ~ .home-section nav{
  left: 60px;
  width: calc(100% - 60px);
}
.home-section nav .sidebar-button{
  display: flex;
  align-items: center;
  font-size: 24px;
  font-weight: 700;
}
nav .sidebar-button i{
  font-size: 35px;
  margin-right: 10px;
}
.home-section .home-content{
  position: relative;
  padding-top: 104px;
}
.home-content .overview-boxes{
  display: flex;
  align-items: center;
  justify-content: space-between;
  flex-wrap: wrap;
  padding: 0 20px;
  margin-bottom: 26px;
}
.overview-boxes .box{
  display: flex;
  align-items: center;
  justify-content: center;
  width: calc(100% / 4 - 15px);
  background: #fff;
  padding: 15px 14px;
  border-radius: 12px;
  box-shadow: 0 5px 10px rgba(0,0,0,0.1);
}
.overview-boxes .box-topic{
  font-size: 20px;
  font-weight: 500;
}
.home-content .box .number{
  display: inline-block;
  font-size: 35px;
  margin-top: -6px;
  font-weight: 500;
}
.home-content .box .indicator{
  display: flex;
  align-items: center;
}
.home-content .box .indicator i{
  height: 20px;
  width: 20px;
  background: #8FDACB;
  line-height: 20px;
  text-align: center;
  border-radius: 50%;
  color: #fff;
  font-size: 20px;
  margin-right: 5px;
}
.box .indicator i.down{
  background: #e87d88;
}
.home-content .box .indicator .text{
  font-size: 12px;
}
.home-content .box .readings{
  display: inline-block;
  font-size: 32px;
  height: 50px;
  width: 50px;
  line-height: 50px;
  text-align: center;
  color: #ff6666;
  border-radius: 12px;
  margin: -15px 0 0 6px;
}
.home-content .box .cart.two{
   color: #2BD47D;
   background: #C0F2D8;
 }
.home-content .box .cart.three{
   color: #ffc233;
   background: #ffe8b3;
 }
.home-content .box .cart.four{
   color: #e05260;
   background: #f7d4d7;
 }
.home-content .total-order{
  font-size: 20px;
  font-weight: 500;
}
.home-content .graph-box{
  display: flex;
  justify-content: space-between;
}
/* left box */
.home-content .graph-box .history-charts{
  width: 70%;
  background: #fff;
  padding: 20px 30px;
  margin: 0 20px;
  border-radius: 12px;
  box-shadow: 0 5px 10px rgba(0, 0, 0, 0.1);
}
.home-content .graph-box .history-charts{
  display: flex;
  flex-flow: column wrap;
}
.home-content .graph-box .history-details{
  display: flex;
  justify-content: space-between;
}

.home-content .graph-box .history-details .history-col-item{
  width: 50%;
  display: flex;
  flex-flow: column nowrap;
  align-items: center;
  justify-content: center;
}

.graph-box .title{
  font-size: 24px;
  font-weight: 500;
}

.home-content .graph-box .history-details .history-divs{
  margin-top: 20px;
  border-radius: 12px;
  box-shadow: 0 5px 10px rgba(0, 0, 0, 0.1);
}

/* Right box */
.home-content .graph-box .gaugeCharts{
  width: 30%;
  background: #fff;
  padding: 20px 30px;
  margin: 0 20px 0 0;
  border-radius: 12px;
  box-shadow: 0 5px 10px rgba(0, 0, 0, 0.1);

}

.home-content .graph-box .gaugeCharts .gauge-list{
  display: flex;
  align-items: center;
  flex-flow: column nowrap;
}
main.js
This file is the heart and soul of our web application as it does several things for us. First, it initializes all of our graphs and charts. Next, it periodically communicates with our web server to retrieve the latest BMP280/BME280 sensor readings. And lastly, it updates our sensor readings text and records the history of our last 12 readings to be displayed as line charts.
var temperatureHistoryDiv = document.getElementById("temperature-history");
var humidityHistoryDiv = document.getElementById("humidity-history");
var pressureHistoryDiv = document.getElementById("pressure-history");
var altitudeHistoryDiv = document.getElementById("altitude-history");

var temperatureGaugeDiv = document.getElementById("temperature-gauge");
var humidityGaugeDiv = document.getElementById("humidity-gauge");
var pressureGaugeDiv = document.getElementById("pressure-gauge");
var altitudeGaugeDiv = document.getElementById("altitude-gauge");

// History Data
var temperatureTrace = {
  x: [],
  y: [],
  name: "Temperature",
  mode: "lines+markers",
  type: "line",
};
var humidityTrace = {
  x: [],
  y: [],
  name: "Humidity",
  mode: "lines+markers",
  type: "line",
};
var pressureTrace = {
  x: [],
  y: [],
  name: "Pressure",
  mode: "lines+markers",
  type: "line",
};
var altitudeTrace = {
  x: [],
  y: [],
  name: "Altitude",
  mode: "lines+markers",
  type: "line",
};

var temperatureLayout = {
  autosize: false,
  title: {
    text: "Temperature",
  },
  font: {
    size: 14,
    color: "#7f7f7f",
  },
  colorway: ["#B22222"],
  width: 450,
  height: 260,
  margin: { t: 30, b: 20, pad: 5 },
};
var humidityLayout = {
  autosize: false,
  title: {
    text: "Humidity",
  },
  font: {
    size: 14,
    color: "#7f7f7f",
  },
  colorway: ["#00008B"],
  width: 450,
  height: 260,
  margin: { t: 30, b: 20, pad: 5 },
};
var pressureLayout = {
  autosize: false,
  title: {
    text: "Pressure",
  },
  font: {
    size: 14,
    color: "#7f7f7f",
  },
  colorway: ["#FF4500"],
  width: 450,
  height: 260,
  margin: { t: 30, b: 20, pad: 5 },
};
var altitudeLayout = {
  autosize: false,
  title: {
    text: "Altitude",
  },
  font: {
    size: 14,
    color: "#7f7f7f",
  },
  colorway: ["#008080"],
  width: 450,
  height: 260,
  margin: { t: 30, b: 20, pad: 5 },
};

Plotly.newPlot(temperatureHistoryDiv, [temperatureTrace], temperatureLayout);
Plotly.newPlot(humidityHistoryDiv, [humidityTrace], humidityLayout);
Plotly.newPlot(pressureHistoryDiv, [pressureTrace], pressureLayout);
Plotly.newPlot(altitudeHistoryDiv, [altitudeTrace], altitudeLayout);

// Gauge Data
var temperatureData = [
  {
    domain: { x: [0, 1], y: [0, 1] },
    value: 0,
    title: { text: "Temperature" },
    type: "indicator",
    mode: "gauge+number+delta",
    delta: { reference: 30 },
    gauge: {
      axis: { range: [null, 50] },
      steps: [
        { range: [0, 20], color: "lightgray" },
        { range: [20, 30], color: "gray" },
      ],
      threshold: {
        line: { color: "red", width: 4 },
        thickness: 0.75,
        value: 30,
      },
    },
  },
];

var humidityData = [
  {
    domain: { x: [0, 1], y: [0, 1] },
    value: 0,
    title: { text: "Humidity" },
    type: "indicator",
    mode: "gauge+number+delta",
    delta: { reference: 50 },
    gauge: {
      axis: { range: [null, 100] },
      steps: [
        { range: [0, 20], color: "lightgray" },
        { range: [20, 30], color: "gray" },
      ],
      threshold: {
        line: { color: "red", width: 4 },
        thickness: 0.75,
        value: 30,
      },
    },
  },
];

var pressureData = [
  {
    domain: { x: [0, 1], y: [0, 1] },
    value: 0,
    title: { text: "Pressure" },
    type: "indicator",
    mode: "gauge+number+delta",
    delta: { reference: 750 },
    gauge: {
      axis: { range: [null, 1100] },
      steps: [
        { range: [0, 300], color: "lightgray" },
        { range: [300, 700], color: "gray" },
      ],
      threshold: {
        line: { color: "red", width: 4 },
        thickness: 0.75,
        value: 30,
      },
    },
  },
];

var altitudeData = [
  {
    domain: { x: [0, 1], y: [0, 1] },
    value: 0,
    title: { text: "Altitude" },
    type: "indicator",
    mode: "gauge+number+delta",
    delta: { reference: 60 },
    gauge: {
      axis: { range: [null, 150] },
      steps: [
        { range: [0, 50], color: "lightgray" },
        { range: [50, 100], color: "gray" },
      ],
      threshold: {
        line: { color: "red", width: 4 },
        thickness: 0.75,
        value: 30,
      },
    },
  },
];

var layout = { width: 300, height: 250, margin: { t: 0, b: 0, l: 0, r: 0 } };

Plotly.newPlot(temperatureGaugeDiv, temperatureData, layout);
Plotly.newPlot(humidityGaugeDiv, humidityData, layout);
Plotly.newPlot(pressureGaugeDiv, pressureData, layout);
Plotly.newPlot(altitudeGaugeDiv, altitudeData, layout);

// Will hold the arrays we receive from our BME280 sensor
// Temperature
let newTempXArray = [];
let newTempYArray = [];
// Humidity
let newHumidityXArray = [];
let newHumidityYArray = [];
// Pressure
let newPressureXArray = [];
let newPressureYArray = [];
// Altitude
let newAltitudeXArray = [];
let newAltitudeYArray = [];

// The maximum number of data points displayed on our scatter/line graph
let MAX_GRAPH_POINTS = 12;
let ctr = 0;

// Callback function that will retrieve our latest sensor readings and redraw our Gauge with the latest readings
function updateSensorReadings() {
  fetch(`/sensorReadings`)
    .then((response) => response.json())
    .then((jsonResponse) => {
      let temperature = jsonResponse.temperature.toFixed(2);
      let humidity = jsonResponse.humidity.toFixed(2);
      let pressure = jsonResponse.pressure.toFixed(2);
      let altitude = jsonResponse.altitude.toFixed(2);

      updateBoxes(temperature, humidity, pressure, altitude);

      updateGauge(temperature, humidity, pressure, altitude);

      // Update Temperature Line Chart
      updateCharts(
        temperatureHistoryDiv,
        newTempXArray,
        newTempYArray,
        temperature
      );
      // Update Humidity Line Chart
      updateCharts(
        humidityHistoryDiv,
        newHumidityXArray,
        newHumidityYArray,
        humidity
      );
      // Update Pressure Line Chart
      updateCharts(
        pressureHistoryDiv,
        newPressureXArray,
        newPressureYArray,
        pressure
      );

      // Update Altitude Line Chart
      updateCharts(
        altitudeHistoryDiv,
        newAltitudeXArray,
        newAltitudeYArray,
        altitude
      );
    });
}

function updateBoxes(temperature, humidity, pressure, altitude) {
  let temperatureDiv = document.getElementById("temperature");
  let humidityDiv = document.getElementById("humidity");
  let pressureDiv = document.getElementById("pressure");
  let altitudeDiv = document.getElementById("altitude");

  temperatureDiv.innerHTML = temperature + " C";
  humidityDiv.innerHTML = humidity + " %";
  pressureDiv.innerHTML = pressure + " hPa";
  altitudeDiv.innerHTML = altitude + " m";
}

function updateGauge(temperature, humidity, pressure, altitude) {
  var temperature_update = {
    value: temperature,
  };
  var humidity_update = {
    value: humidity,
  };
  var pressure_update = {
    value: pressure,
  };
  var altitude_update = {
    value: altitude,
  };
  Plotly.update(temperatureGaugeDiv, temperature_update);
  Plotly.update(humidityGaugeDiv, humidity_update);
  Plotly.update(pressureGaugeDiv, pressure_update);
  Plotly.update(altitudeGaugeDiv, altitude_update);
}

function updateCharts(lineChartDiv, xArray, yArray, sensorRead) {
  if (xArray.length >= MAX_GRAPH_POINTS) {
    xArray.shift();
  }
  if (yArray.length >= MAX_GRAPH_POINTS) {
    yArray.shift();
  }
  xArray.push(ctr++);
  yArray.push(sensorRead);

  var data_update = {
    x: [xArray],
    y: [yArray],
  };

  Plotly.update(lineChartDiv, data_update);
}

// Continuos loop that runs evry 3 seconds to update our web page with the latest sensor readings
(function loop() {
  setTimeout(() => {
    updateSensorReadings();
    loop();
  }, 3000);
})();
Let us run through what each line does.
var temperatureHistoryDiv = document.getElementById("temperature-history");
var humidityHistoryDiv = document.getElementById("humidity-history");
var pressureHistoryDiv = document.getElementById("pressure-history");
var altitudeHistoryDiv = document.getElementById("altitude-history");

var temperatureGaugeDiv = document.getElementById("temperature-gauge");
var humidityGaugeDiv = document.getElementById("humidity-gauge");
var pressureGaugeDiv = document.getElementById("pressure-gauge");
var altitudeGaugeDiv = document.getElementById("altitude-gauge");
Declare all the HTML div elements that will display our charts wherein Plotly.js would auto-populate its content.
// History Data
var temperatureTrace = {
  x: [],
  y: [],
  name: "Temperature",
  mode: "lines+markers",
  type: "line",
};
var humidityTrace = {
  x: [],
  y: [],
  name: "Humidity",
  mode: "lines+markers",
  type: "line",
};
var pressureTrace = {
  x: [],
  y: [],
  name: "Pressure",
  mode: "lines+markers",
  type: "line",
};
var altitudeTrace = {
  x: [],
  y: [],
  name: "Altitude",
  mode: "lines+markers",
  type: "line",
};

var temperatureLayout = {
  autosize: false,
  title: {
    text: "Temperature",
  },
  font: {
    size: 14,
    color: "#7f7f7f",
  },
  colorway: ["#B22222"],
  width: 450,
  height: 260,
  margin: { t: 30, b: 20, pad: 5 },
};
var humidityLayout = {
  autosize: false,
  title: {
    text: "Humidity",
  },
  font: {
    size: 14,
    color: "#7f7f7f",
  },
  colorway: ["#00008B"],
  width: 450,
  height: 260,
  margin: { t: 30, b: 20, pad: 5 },
};
var pressureLayout = {
  autosize: false,
  title: {
    text: "Pressure",
  },
  font: {
    size: 14,
    color: "#7f7f7f",
  },
  colorway: ["#FF4500"],
  width: 450,
  height: 260,
  margin: { t: 30, b: 20, pad: 5 },
};
var altitudeLayout = {
  autosize: false,
  title: {
    text: "Altitude",
  },
  font: {
    size: 14,
    color: "#7f7f7f",
  },
  colorway: ["#008080"],
  width: 450,
  height: 260,
  margin: { t: 30, b: 20, pad: 5 },
};

Plotly.newPlot(temperatureHistoryDiv, [temperatureTrace], temperatureLayout);
Plotly.newPlot(humidityHistoryDiv, [humidityTrace], humidityLayout);
Plotly.newPlot(pressureHistoryDiv, [pressureTrace], pressureLayout);
Plotly.newPlot(altitudeHistoryDiv, [altitudeTrace], altitudeLayout);
We initialize all of our line charts with configuration data (e.g temperatureTrace etc.) and configure the layout of each graph. The code Plotly.newPlot() will create a blank chart for us.
// Gauge Data
var temperatureData = [
  {
    domain: { x: [0, 1], y: [0, 1] },
    value: 0,
    title: { text: "Temperature" },
    type: "indicator",
    mode: "gauge+number+delta",
    delta: { reference: 30 },
    gauge: {
      axis: { range: [null, 50] },
      steps: [
        { range: [0, 20], color: "lightgray" },
        { range: [20, 30], color: "gray" },
      ],
      threshold: {
        line: { color: "red", width: 4 },
        thickness: 0.75,
        value: 30,
      },
    },
  },
];

var humidityData = [
  {
    domain: { x: [0, 1], y: [0, 1] },
    value: 0,
    title: { text: "Humidity" },
    type: "indicator",
    mode: "gauge+number+delta",
    delta: { reference: 50 },
    gauge: {
      axis: { range: [null, 100] },
      steps: [
        { range: [0, 20], color: "lightgray" },
        { range: [20, 30], color: "gray" },
      ],
      threshold: {
        line: { color: "red", width: 4 },
        thickness: 0.75,
        value: 30,
      },
    },
  },
];

var pressureData = [
  {
    domain: { x: [0, 1], y: [0, 1] },
    value: 0,
    title: { text: "Pressure" },
    type: "indicator",
    mode: "gauge+number+delta",
    delta: { reference: 750 },
    gauge: {
      axis: { range: [null, 1100] },
      steps: [
        { range: [0, 300], color: "lightgray" },
        { range: [300, 700], color: "gray" },
      ],
      threshold: {
        line: { color: "red", width: 4 },
        thickness: 0.75,
        value: 30,
      },
    },
  },
];

var altitudeData = [
  {
    domain: { x: [0, 1], y: [0, 1] },
    value: 0,
    title: { text: "Altitude" },
    type: "indicator",
    mode: "gauge+number+delta",
    delta: { reference: 60 },
    gauge: {
      axis: { range: [null, 150] },
      steps: [
        { range: [0, 50], color: "lightgray" },
        { range: [50, 100], color: "gray" },
      ],
      threshold: {
        line: { color: "red", width: 4 },
        thickness: 0.75,
        value: 30,
      },
    },
  },
];

var layout = { width: 300, height: 250, margin: { t: 0, b: 0, l: 0, r: 0 } };

Plotly.newPlot(temperatureGaugeDiv, temperatureData, layout);
Plotly.newPlot(humidityGaugeDiv, humidityData, layout);
Plotly.newPlot(pressureGaugeDiv, pressureData, layout);
Plotly.newPlot(altitudeGaugeDiv, altitudeData, layout);
The code above, on the other hand, will display the gauge charts that are displayed at the right-hand part of our home section.
// Will hold the arrays we receive from our BME280 sensor
// Temperature
let newTempXArray = [];
let newTempYArray = [];
// Humidity
let newHumidityXArray = [];
let newHumidityYArray = [];
// Pressure
let newPressureXArray = [];
let newPressureYArray = [];
// Altitude
let newAltitudeXArray = [];
let newAltitudeYArray = [];

// The maximum number of data points displayed on our scatter/line graph
let MAX_GRAPH_POINTS = 12;
let ctr = 0;
All the array variables above will hold the last 12 historical readings in our line charts.
Each sensor reading is assigned a unique number by using the ctr a variable that gets increased for each request.
// Callback function that will retrieve our latest sensor readings and redraw our Gauge with the latest readings
function updateSensorReadings() {
  fetch(`/sensorReadings`)
    .then((response) => response.json())
    .then((jsonResponse) => {
      let temperature = jsonResponse.temperature.toFixed(2);
      let humidity = jsonResponse.humidity.toFixed(2);
      let pressure = jsonResponse.pressure.toFixed(2);
      let altitude = jsonResponse.altitude.toFixed(2);

      updateBoxes(temperature, humidity, pressure, altitude);

      updateGauge(temperature, humidity, pressure, altitude);

      // Update Temperature Line Chart
      updateCharts(
        temperatureHistoryDiv,
        newTempXArray,
        newTempYArray,
        temperature
      );
      // Update Humidity Line Chart
      updateCharts(
        humidityHistoryDiv,
        newHumidityXArray,
        newHumidityYArray,
        humidity
      );
      // Update Pressure Line Chart
      updateCharts(
        pressureHistoryDiv,
        newPressureXArray,
        newPressureYArray,
        pressure
      );

      // Update Altitude Line Chart
      updateCharts(
        altitudeHistoryDiv,
        newAltitudeXArray,
        newAltitudeYArray,
        altitude
      );
    });
}
The function updateSensorReadings() will call our “/sensorReadings” route from our web server. Its job is to handle the response and convert it to a JSON format and then it will extract the result and assign it to local variables.
Shown below is a sample JSON response when calling the “/sensorReadings” endpoint called.

Functions updateBoxes(), updateGauge(), and updateCharts() are then called to update the line graph and gauge content.
function updateBoxes(temperature, humidity, pressure, altitude) {
  let temperatureDiv = document.getElementById("temperature");
  let humidityDiv = document.getElementById("humidity");
  let pressureDiv = document.getElementById("pressure");
  let altitudeDiv = document.getElementById("altitude");

  temperatureDiv.innerHTML = temperature + " C";
  humidityDiv.innerHTML = humidity + " %";
  pressureDiv.innerHTML = pressure + " hPa";
  altitudeDiv.innerHTML = altitude + " m";
}
The function updateBoxes() will update the values that are displayed at the top of our page.
function updateGauge(temperature, humidity, pressure, altitude) {
  var temperature_update = {
    value: temperature,
  };
  var humidity_update = {
    value: humidity,
  };
  var pressure_update = {
    value: pressure,
  };
  var altitude_update = {
    value: altitude,
  };
  Plotly.update(temperatureGaugeDiv, temperature_update);
  Plotly.update(humidityGaugeDiv, humidity_update);
  Plotly.update(pressureGaugeDiv, pressure_update);
  Plotly.update(altitudeGaugeDiv, altitude_update);
}
updateGauge() will update the display of our gauge charts by calling the Plotly.update() javascript function.
function updateCharts(lineChartDiv, xArray, yArray, sensorRead) {
  if (xArray.length >= MAX_GRAPH_POINTS) {
    xArray.shift();
  }
  if (yArray.length >= MAX_GRAPH_POINTS) {
    yArray.shift();
  }
  xArray.push(ctr++);
  yArray.push(sensorRead);

  var data_update = {
    x: [xArray],
    y: [yArray],
  };

  Plotly.update(lineChartDiv, data_update);
}
updateCharts() will update all of our line charts.
// Continuos loop that runs evry 3 seconds to update our web page with the latest sensor readings
(function loop() {
  setTimeout(() => {
    updateSensorReadings();
    loop();
  }, 3000);
})();
The function updateSensorReadings() is then called to get the latest reading every 3 seconds.
How to run the Raspberry Pi Pico W BMP280/BME280 Weather Station Project?
Install first all the required libraries for this project.
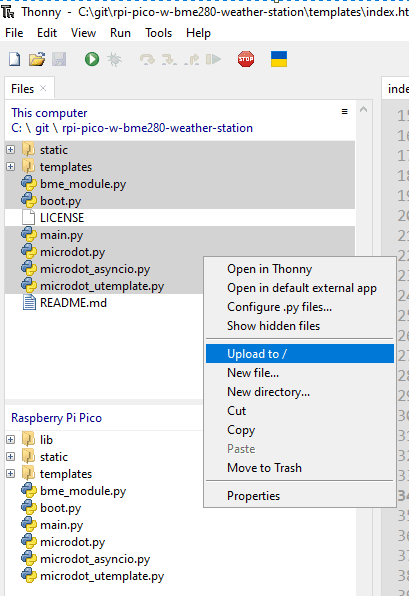
Select all the files for this project and using Thonny, upload it to the file system of your Raspberry Pi Pico W.
Open your browser and type in the following in the IP in the address bar then you should be seeing our web application displayed.
http://192.168.100.223:5000/Issues
TypeError: ‘id’ argument required
Make sure that the id parameter is passed when creating the machine.I2C Please see the documentation.
self.i2c = machine.I2C(id=id, scl=machine.Pin(scl_pin), sda=machine.Pin(sda_pin), freq=400000)ValueError: bad SCL pin
Check that the id you are passing is matching the SCL channel. If you are using the hardware I2C pins then it should default to zero.
OSError: [Errno 5] EIO
Resocket your USB connection to your MicroPython board
Wrap up
We have created and learned how to interface our Raspberry Pi Pico W code with the BMP280/BME280 sensors in this post. Also, we were able to create a weather station dashboard that automatically displays the sensor readings in big text and colorful charts that automatically updates themselves asynchronously.
Related Next:
Using Arduino with BME280 plus a weather station project
Building a MicroPython Wifi Robot Car
Leave a Reply