Introduction
The following tutorial will show you how to interface your DHT11 sensor to retrieve temperature and relative humidity readings using your MicroPython device. We first start with how to read the sensor readings using MicroPython and then finish it off with a weather station that automatically updates itself from the DHT11 sensor readings.
If you want to see this project in a video format then please see below. You can also watch this on my YouTube channel.
Prerequisites
The following are the components needed to follow along with this post.
- MicroPython board (I used an ESP32) – Amazon | AliExpress | Bangood
- DHT11 Sensor Module (with PCB and 3 Pins) – Amazon | AliExpress | Bangood
- Breadboard – Amazon | AliExpress | Bangood
- Jumper Wires – Amazon | AliExpress | Bangood
Disclosure: These are affiliate links and I will earn small commissions to support my site when you buy through these links.
You should have installed the latest MicroPython-compatible firmware on your device. I have used Thonny IDE in developing this project.
If you are unsure of all the items above then please take a look at the links below before moving forward.
Must Read:
How to install MicroPython on ESP32 and download firmware
MicroPython Development Using Thonny IDE
You need to understand how the MicroDot library works if you want to know how I created my DHT11 MicroPython weather station in the latter part of this post. I highly recommend going over my earlier post about how to get started with MicroDot before moving forward.
Must Read:
Develop MicroPython Application using MicroDot
How to create a MicroPython Web Server the easy way!
What is the DHT11 sensor?
The DHT11 is a factory-calibrated sensor that outputs a digital signal output suitable for reading by any Microcontroller board such as the Arduino or Raspberry Pi. It was developed by Aosong Electronics and has the following specifications.
| Operating Voltage | 3.3 – 5 V |
| Accuracy | Relative Humidity – (+/-) 5% Temperature – (+/-) 2 degree |
| Sampling Period | 2 seconds |
| Temperature Range | 0 – 50 Degree Celcius |
| Relative Humidity Range | 20 – 90 % |
This sensor may come as a standalone 4 Pin configuration or as a sensor module where external components are added and engraved in a PCB. In this project, we are gonna be using the sensor module.
This is a cheap sensor that is useful in weather stations, HVAC, or monitoring projects.
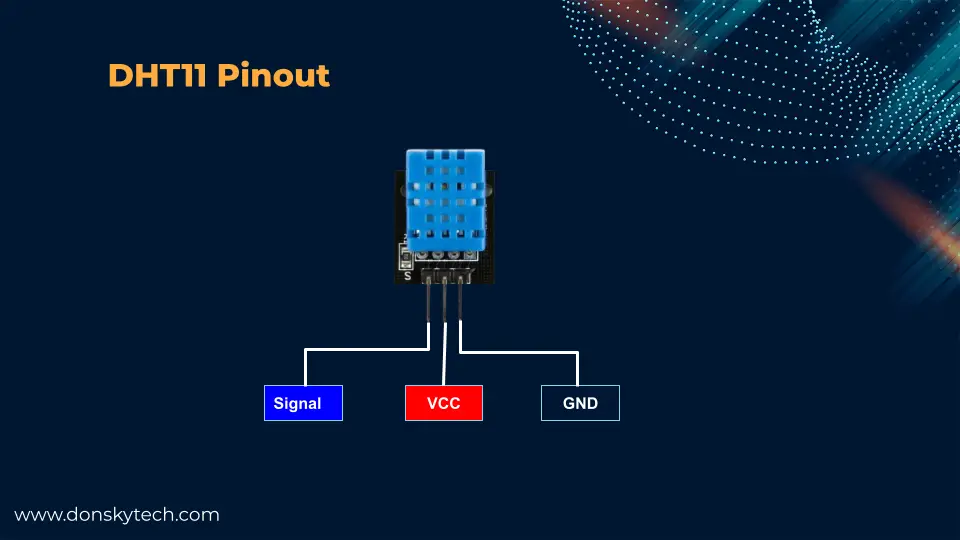
DHT11 Pinout
Take note that the DHT11 component that I am using here is of the module type that is engraved in a PCB together with some resistor. It has 3 external pins that most of the time have the following pin sequence. Check your own DHT11 modules as the Signal pin could sometimes be sandwiched between the VCC and GND pins.
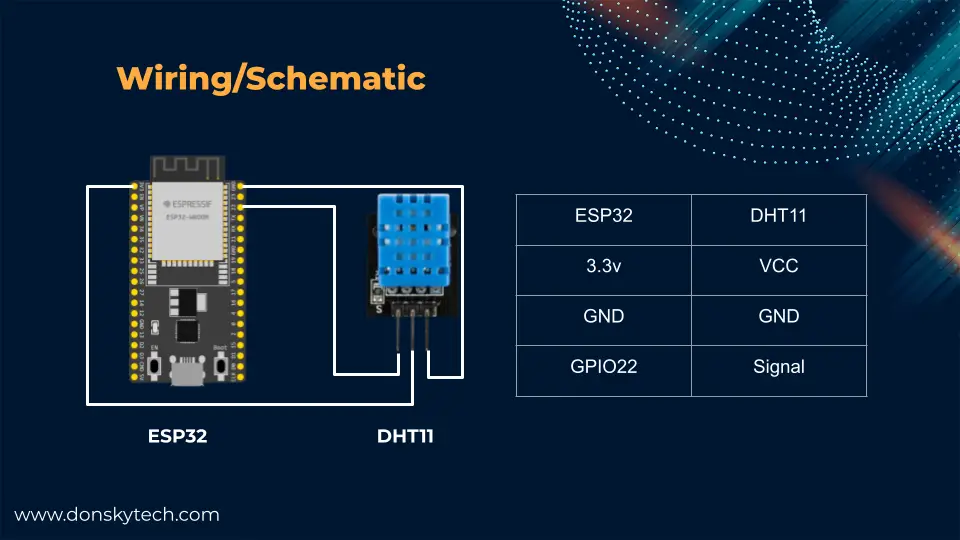
Wiring/Schematic
The image below is the schematic diagram of how we are going to connect our DHT11 sensor with our MicroPython device which in this case is an ESP32 Microcontroller unit.
I have assigned GPIO22 as my signal pin but other pins that support input and output capability can be used as well.
Code
Read DHT11 Sensor data with MicroPython
The following is the code for reading the sensor reads coming from your DHT11 sensor. This is also available in my GitHub repository.
from machine import Pin
from time import sleep
import dht

dht_sensor = dht.DHT11(Pin(22))

while True:
    try:
        dht_sensor.measure()
        temperature = dht_sensor.temperature()
        humidity = dht_sensor.humidity()
        print(f"Temperature: {temperature:.2f}")
        print(f"Humidity: {humidity:.2f}")
        sleep(2)
    except OSError as e:
        print(e)
        print('dht_sensor Reading Failed')
Let us go over what each line of the code does.
from machine import Pin
from time import sleep
import dht

dht_sensor = dht.DHT11(Pin(22))
We import several modules from the machine package to read our DHT11 sensor. MicroPython has built-in support for reading the DHT11 sensor and we need to import the dht package. We then create the class DHT11 and pass the parameter Pin that is initialized with GPIO22.
while True:
    try:
        dht_sensor.measure()
        temperature = dht_sensor.temperature()
        humidity = dht_sensor.humidity()
        print(f"Temperature: {temperature:.2f}")
        print(f"Humidity: {humidity:.2f}")
        sleep(2)
    except OSError as e:
        print(e)
        print('dht_sensor Reading Failed')
In an infinite loop, we call the dht_sensor.measure() method to read the values sensed by the sensor. We are able to access the value of the temperature and humidity by calling the following methods:
dht_sensor.temperature()dht_sensor.humidity()
We print the readings using Python f string and then we sleep for 2 seconds. In case of an error, our try-except block will print the error message.
This is how simple it is to interface and read the values of our DHT11 sensor with our MicroPython code.
The next part of the project will make this a little bit more interesting as we are going to show the sensor reads by using a web server and the library MicroDot.
DHT11 MicroPython Powered Weather Station
This part of this post will display the sensor reading in a web application hosted by a web server running in our MicroPython device using the MicroDot library. If you want to know how I did this project from scratch then I highly recommend that you read the following links below.
Must Read:
Develop MicroPython Application using MicroDot
How to create a MicroPython Web Server the easy way!
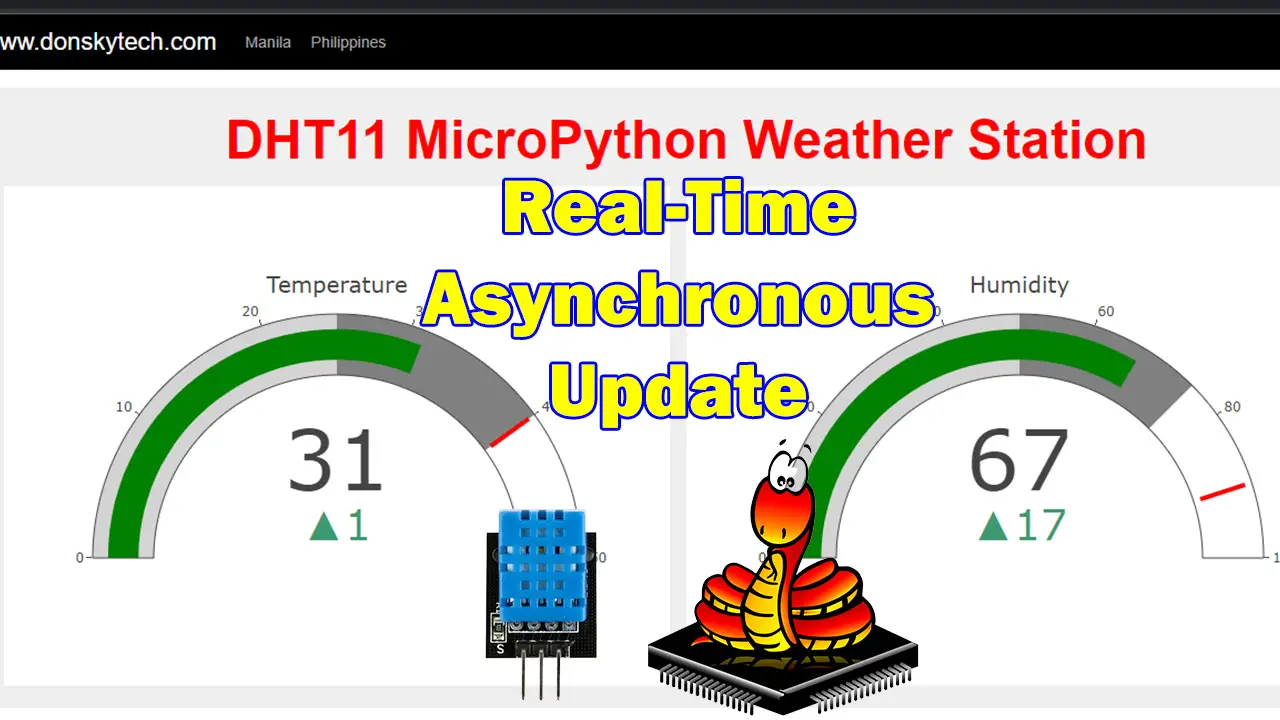
We will be displaying a Gauge visualization chart that gets updated in almost real-time using the Plotly javascript library.
Design
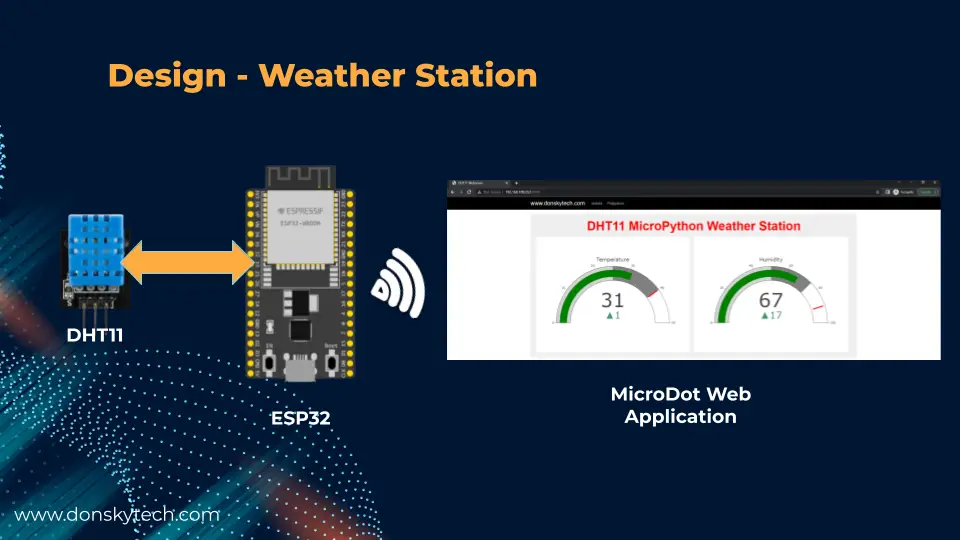
The image above is the design of our DHT11 MicroPython-powered Weather station. We created a web application built using MicroDot that displays DHT sensor reads as a Gauge.
Code
The complete code for this project is also available in my GitHub repository. You can either clone the project if you have Git installed or download it as a zip file.
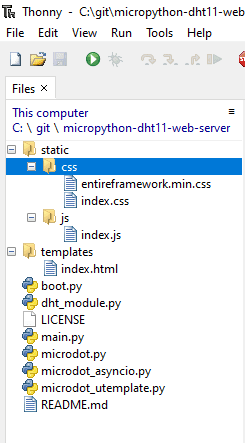
https://github.com/donskytech/micropython-dht11-web-server.gitWhen you open the project then the following files will be displayed to you. Let us go over what each file does.
boot.py
The boot.py is the first file being read by the MicroPython interpreter and its job is to connect to our Wifi network.
# boot.py -- run on boot-up
import network, utime

# Replace the following with your WIFI Credentials
SSID = "<PLACE_YOUR_SSID_HERE>"
SSI_PASSWORD = "<PLACE_YOUR_WIFI_PASWORD_HERE>"

def do_connect():
    import network
    sta_if = network.WLAN(network.STA_IF)
    if not sta_if.isconnected():
        print('connecting to network...')
        sta_if.active(True)
        sta_if.connect(SSID, SSI_PASSWORD)
        while not sta_if.isconnected():
            pass
    print('Connected! Network config:', sta_if.ifconfig())

print("Connecting to your wifi...")
do_connect()
Make sure to replace the following values with your Wifi credential before deploying it into your MicroPython device.
# Replace the following with your WIFI Credentials
SSID = "<PLACE_YOUR_SSID_HERE>"
SSI_PASSWORD = "<PLACE_YOUR_WIFI_PASWORD_HERE>"
The code will continually loop until it is able to connect to your Wifi and be assigned a specific IP Address.
def do_connect():
    import network
    sta_if = network.WLAN(network.STA_IF)
    if not sta_if.isconnected():
        print('connecting to network...')
        sta_if.active(True)
        sta_if.connect(SSID, SSI_PASSWORD)
        while not sta_if.isconnected():
            pass
    print('Connected! Network config:', sta_if.ifconfig())

print("Connecting to your wifi...")
do_connect()
When it has successfully connected then you would see the following messages in your Thonny IDE Shell.
Connecting to your wifi...
Connected! Network config: ('192.168.100.253', '255.255.255.0', '192.168.100.1', '192.168.100.1')
main.py
The main.py contains the main logic of our program and it serves as the heart of our application. The web server logic is embedded inside this code and it handles the HTTP request-response cycle coming from our browser. This is powered by the MicroDot library.
from microdot_asyncio import Microdot, Response, send_file
from microdot_utemplate import render_template
from dht_module import DHTModule
import ujson

# Our DHT Module
dht_sensor = DHTModule(22)

app = Microdot()
Response.default_content_type = 'text/html'


@app.route('/')
async def index(request):
    return render_template('index.html')


@app.route('/updateValues')
async def get_dht_reads(request):
    print("Receive get values request!")
    sensor_reads = dht_sensor.get_values()
    return ujson.dumps(sensor_reads)


@app.route('/shutdown')
async def shutdown(request):
    request.app.shutdown()
    return 'The server is shutting down...'


@app.route('/static/<path:path>')
def static(request, path):
    if '..' in path:
        # directory traversal is not allowed
        return 'Not found', 404
    return send_file('static/' + path)

app.run()
Let us go over what each line of code does for you to understand its role.
from microdot_asyncio import Microdot, Response, send_file
from microdot_utemplate import render_template
from dht_module import DHTModule
import ujson
Import the necessary packages for the MicroDot, our custom DHTModule that will interface with our DHT11 sensor, and the ujson package to format the response.
# Our DHT Module
dht_sensor = DHTModule(22)

app = Microdot()
Response.default_content_type = 'text/html'
We create an instance of our DHTModule passing in GPIO22 where we connect our DHT11 and assigned it to the dht_sensor variable. Afterwhich, we create an instance of our MicroDot application and set the default response to “text/html“
@app.route('/')
async def index(request):
    return render_template('index.html')
We first define our index or root route and this will render our template called index.html. If you are not familiar with what a MicroDot template is then please see this Using Templates in my earlier post.
@app.route('/updateValues')
async def get_dht_reads(request):
    print("Receive get values request!")
    sensor_reads = dht_sensor.get_values()
    return ujson.dumps(sensor_reads)
The following routes will read the values in our dht_sensor variable by calling the dht_sensor.get_values(). The temperature and humidity values are then returned as a JSON objects. This route is called to asynchronously update our web page and show the latest sensor reads.
@app.route('/shutdown')
async def shutdown(request):
    request.app.shutdown()
    return 'The server is shutting down...'
This route is called to shut down our MicroDot app.
@app.route('/static/<path:path>')
def static(request, path):
    if '..' in path:
        # directory traversal is not allowed
        return 'Not found', 404
    return send_file('static/' + path)
The route above is used to serve the static HTML and CSS files needed by our web page.
app.run()Executing the command above will run our MicroDot web server application.
dht_module.py
This module is our interface for reading the values from our DHT11 sensor.
from machine import Pin
import dht

class DHTModule:
    def __init__(self, pinNumber):
        self.dht_sensor = dht.DHT11(Pin(pinNumber))

    def get_values(self):
        self.dht_sensor.measure()
        temperature = self.dht_sensor.temperature()
        humidity = self.dht_sensor.humidity()

        print(f"Temperature: {temperature:.2f}")
        print(f"Humidity: {humidity:.2f}")

        return temperature, humidity
Let us run through what each line does.
from machine import Pin
import dht
The command above imports the standard package for us to communicate with our DHT11 sensor.
class DHTModule:
    def __init__(self, pinNumber):
        self.dht_sensor = dht.DHT11(Pin(pinNumber))
The DHTModule class is initialized by passing the GPIO Pin number.
    def get_values(self):
        self.dht_sensor.measure()
        temperature = self.dht_sensor.temperature()
        humidity = self.dht_sensor.humidity()

        print(f"Temperature: {temperature:.2f}")
        print(f"Humidity: {humidity:.2f}")

        return temperature, humidity
The method get_values() will call the measure() method of our dht_sensor and if everything is okay then we are able to retrieve the temperature and humidity values.
The sensor readings are then printed to our console and it is returned as a Python tuple.
templates/index.html
The index.html is the main user interface that displays our Gauge Visualization chart using the Plotly javascript library.
<!DOCTYPE html>
<html>
   <head>
      <meta charset="UTF-8" />
      <meta name="viewport" content="width=device-width, initial-scale=1" />
      <title>DHT11 Webserver</title>
      <link rel="stylesheet" href="static/css/entireframework.min.css" />
      <link rel="stylesheet" href="static/css/index.css" />
      <!-- Load plotly.js into the DOM -->
      <script src='https://cdn.plot.ly/plotly-2.16.1.min.js'></script>
   </head>
   <body>
      <script src="static/js/index.js"></script>
      <nav class="nav" tabindex="-1" onclick="this.focus()">
         <div class="container">
            <a class="pagename current" href="#">www.donskytech.com</a>
            <a href="#">Manila</a>
            <a href="#">Philippines</a>
         </div>
      </nav>
      <button class="btn-close btn btn-sm">×</button>
      <div class="container">
         <div class="hero">
            <h1 class="title">DHT11 MicroPython Weather Station</h1>
            <div class="graphDiv">
               <div id='temperatureDiv'>
               </div>
               <div id='humidityDiv'>
               </div>
            </div>
         </div>
      </div>
   </body>
</html>
Let us discuss what this HTML page does.
<!DOCTYPE html>
<html>
   <head>
      <meta charset="UTF-8" />
      <meta name="viewport" content="width=device-width, initial-scale=1" />
      <title>DHT11 Webserver</title>
      <link rel="stylesheet" href="static/css/entireframework.min.css" />
      <link rel="stylesheet" href="static/css/index.css" />
      <!-- Load plotly.js into the DOM -->
      <script src='https://cdn.plot.ly/plotly-2.16.1.min.js'></script>
   </head>
We initialized our HTML page by declaring our correct doctype declaration. The head section sets several meta-variables and the title of our Web Application.
We import several CSS files like the entireframework.min.css and our custom index.css
The script tag imports the Plotly javascript library.
<body>
      <script src="static/js/index.js"></script>
      <nav class="nav" tabindex="-1" onclick="this.focus()">
         <div class="container">
            <a class="pagename current" href="#">www.donskytech.com</a>
            <a href="#">Manila</a>
            <a href="#">Philippines</a>
         </div>
      </nav>
      <button class="btn-close btn btn-sm">×</button>
We import the index.js at the body HTML section for lazy loading purposes. The nav tag defines our navigation.
      <div class="container">
         <div class="hero">
            <h1 class="title">DHT11 MicroPython Weather Station</h1>
            <div class="graphDiv">
               <div id='temperatureDiv'>
               </div>
               <div id='humidityDiv'>
               </div>
            </div>
         </div>
      </div>
   </body>
</html>
We define the container section of our web application that includes our title and the divs that will display our Gauge chart.
The div with an id of temperatureDiv and humidityDiv will display our Gauge chart.
static/js/index.js
The index.js job is to update our web application with the latest sensor readings. This file calls several Plotly-related javascript functions that will render our Gauge chart and update its values with the latest sensor reads.
document.addEventListener("DOMContentLoaded", function() {
    // Temperature Gauge Configurations
    var temperatureData = [{
        domain: {
            x: [0, 1],
            y: [0, 1]
        },
        value: 0,
        title: {
            text: "Temperature"
        },
        type: "indicator",
        mode: "gauge+number+delta",
        delta: {
            reference: 30
        },
        gauge: {
            axis: {
                range: [0, 50]
            },
            steps: [{
                    range: [0, 25],
                    color: "lightgray"
                },
                {
                    range: [25, 40],
                    color: "gray"
                }
            ],
            threshold: {
                line: {
                    color: "red",
                    width: 4
                },
                thickness: 0.75,
                value: 40
            }
        }
    }];

    // Humidity Gauge Configurations
    var humidityData = [{
        domain: {
            x: [0, 1],
            y: [0, 1]
        },
        value: 0,
        title: {
            text: "Humidity"
        },
        type: "indicator",
        mode: "gauge+number+delta",
        delta: {
            reference: 50
        },
        gauge: {
            axis: {
                range: [0, 100]
            },
            steps: [{
                    range: [0, 50],
                    color: "lightgray"
                },
                {
                    range: [50, 75],
                    color: "gray"
                }
            ],
            threshold: {
                line: {
                    color: "red",
                    width: 4
                },
                thickness: 0.75,
                value: 90
            }
        }
    }];

    // Layout object that set's the size of our Gauge
    var layout = {
        width: 600,
        height: 450,
        margin: {
            t: 0,
            b: 0
        }
    };

    // Create our two Gauge passing in the different configurations
    Plotly.newPlot('temperatureDiv', temperatureData, layout);
    Plotly.newPlot('humidityDiv', humidityData, layout);

});

// Callback function that will retrieve our latest sensor readings and redraw our Gauge with the latest readings
function updatePlot() {
    console.log("Updating chart");
    fetch(`/updateValues`)
        .then((response) => response.json())
        .then(data => {
            var temp_update = {
                value: data[0]
            };

            Plotly.update("temperatureDiv", temp_update);

            var humidity_update = {
                value: data[1]
            };
            Plotly.update("humidityDiv", humidity_update);

        })
}

// Continuos loop that runs evry 3 seconds to update our web page with the latest sensor readings
(function loop() {
    setTimeout(() => {
        updatePlot()
        loop();
    }, 3000);
})();
I have added several comments for each line of the javascript file for you to understand its use.
document.addEventListener("DOMContentLoaded", function() {We have added a listener function when the HTML DOM (Document Object Model) is loaded.
    // Temperature Gauge Configurations
    var temperatureData = [{
        domain: {
            x: [0, 1],
            y: [0, 1]
        },
        value: 0,
        title: {
            text: "Temperature"
        },
        type: "indicator",
        mode: "gauge+number+delta",
        delta: {
            reference: 30
        },
        gauge: {
            axis: {
                range: [0, 50]
            },
            steps: [{
                    range: [0, 25],
                    color: "lightgray"
                },
                {
                    range: [25, 40],
                    color: "gray"
                }
            ],
            threshold: {
                line: {
                    color: "red",
                    width: 4
                },
                thickness: 0.75,
                value: 40
            }
        }
    }];

    // Humidity Gauge Configurations
    var humidityData = [{
        domain: {
            x: [0, 1],
            y: [0, 1]
        },
        value: 0,
        title: {
            text: "Humidity"
        },
        type: "indicator",
        mode: "gauge+number+delta",
        delta: {
            reference: 50
        },
        gauge: {
            axis: {
                range: [0, 100]
            },
            steps: [{
                    range: [0, 50],
                    color: "lightgray"
                },
                {
                    range: [50, 75],
                    color: "gray"
                }
            ],
            threshold: {
                line: {
                    color: "red",
                    width: 4
                },
                thickness: 0.75,
                value: 90
            }
        }
    }];
The temperatureData javascript variable defines our Temperature Gauge configurations. Please see the following link for Plotly Gauge documentation. It defines the several configuration variables that can be set up.
The humidityData javascript variable defines our Humidity Gauge configurations. Their configurations are both similar except for the title, range, and threshold values.
    // Layout object that set's the size of our Gauge
    var layout = {
        width: 600,
        height: 450,
        margin: {
            t: 0,
            b: 0
        }
    };
The layout variable represents the size of our Gauge graph.
    // Create our two Gauge passing in the different configurations
    Plotly.newPlot('temperatureDiv', temperatureData, layout);
    Plotly.newPlot('humidityDiv', humidityData, layout);
The command above initialized our Plotly Gauges.
// Callback function that will retrieve our latest sensor readings and redraw our Gauge with the latest readings
function updatePlot() {
    console.log("Updating chart");
    fetch(`/updateValues`)
        .then((response) => response.json())
        .then(data => {
            var temp_update = {
                value: data[0]
            };

            Plotly.update("temperatureDiv", temp_update);

            var humidity_update = {
                value: data[1]
            };
            Plotly.update("humidityDiv", humidity_update);

        })
}
The updatePlot javascript function will call our updateValues route to retrieve the latest sensor readings and is using the Fetch API. It then parses the return values and updates our Gauge chart by calling the Plotly.update() function.
// Continuos loop that runs evry 3 seconds to update our web page with the latest sensor readings
(function loop() {
    setTimeout(() => {
        updatePlot()
        loop();
    }, 3000);
})();
This function calls our updatePlot() function continuously every three seconds.
entireframework.min.css and index.css
The entireframework.min.css and index.css are our stylesheets that add stylings to our web page. I am using the mincss CSS framework for basic styling due to its minimal size which is ideal for Microcontrollers that have minimal storage space
How to run this project?
First, we need to install the utemplate library or package into our MicroPython device using Thonny IDE. If you do not know how this is done then please refer to my separate post.
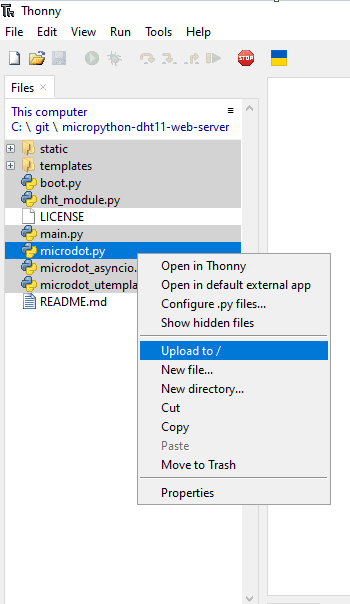
Next, we need to upload all the files into the file system of our MicroPython device using Thonny IDE. If you do not know how this is done then please refer to my separate post
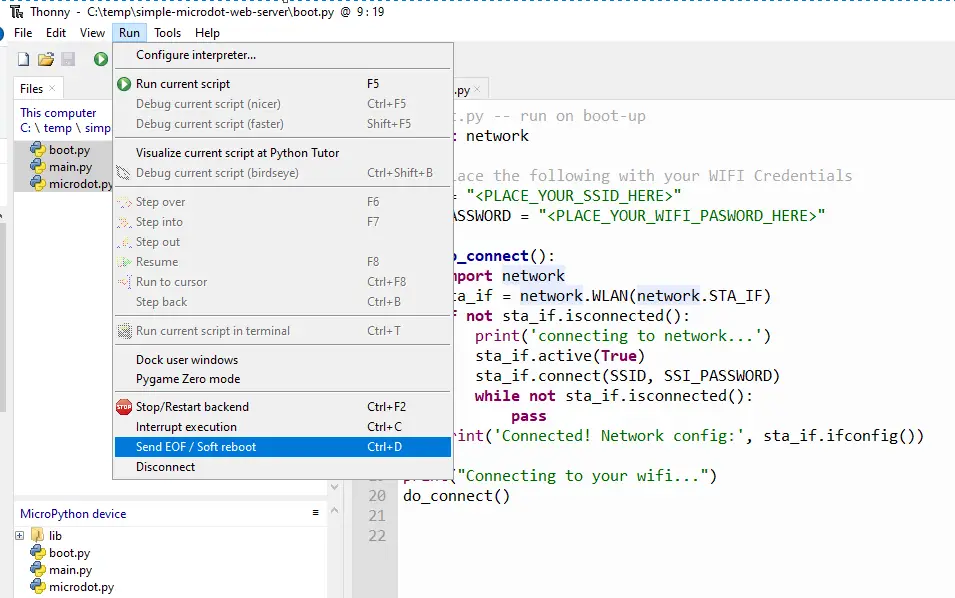
When everything is okay then click Run then Send EOF/Soft Reboot
Continually, send the soft reboot command until you see the following messages displayed
MPY: soft reboot
Connecting to your wifi...
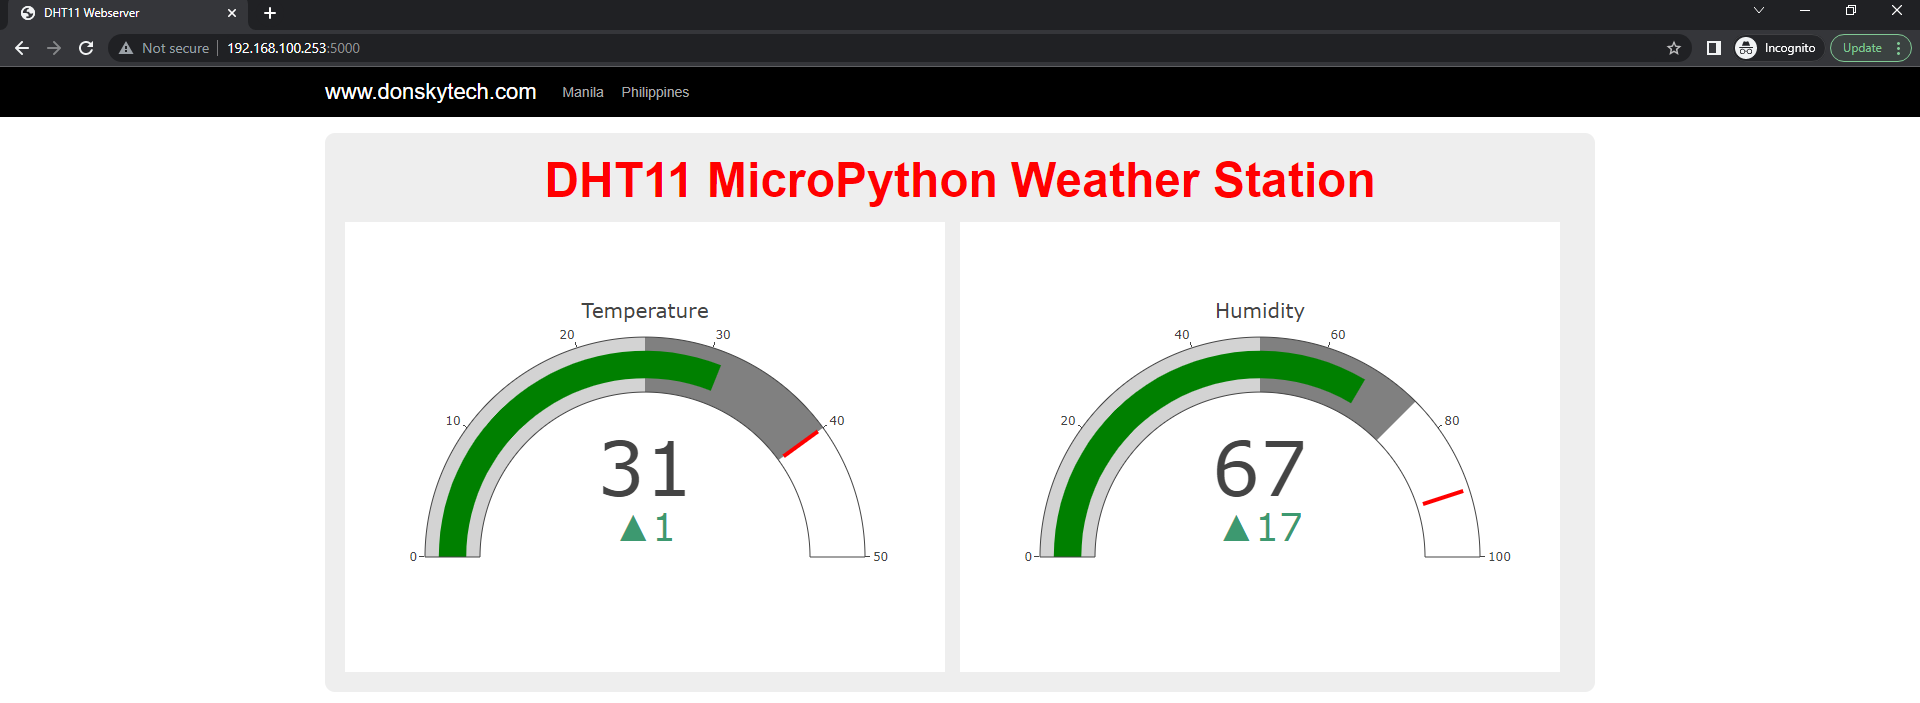
Connected! Network config: ('192.168.100.253', '255.255.255.0', '192.168.100.1', '192.168.100.1')Take note of the IP above and then open your browser and type in the following URL.
http://<IP>:5000You should be able to access our web application. The web application will continually update itself every 3 seconds.
If you have reached this point then Congratulations! You have successfully created your own MicroPython weather station project.
Wrap Up
We have discussed in detail how to interface the DHT11 sensor with our MicroPython code in this post.
If something is not clear then you can comment on this post. I hope you learned something. Happy exploring!
Read Next:
Raspberry Pi Pico W: BME280 Weather Station Dashboard
Using Arduino with BME280 plus a weather station project
Leave a Reply