Introduction
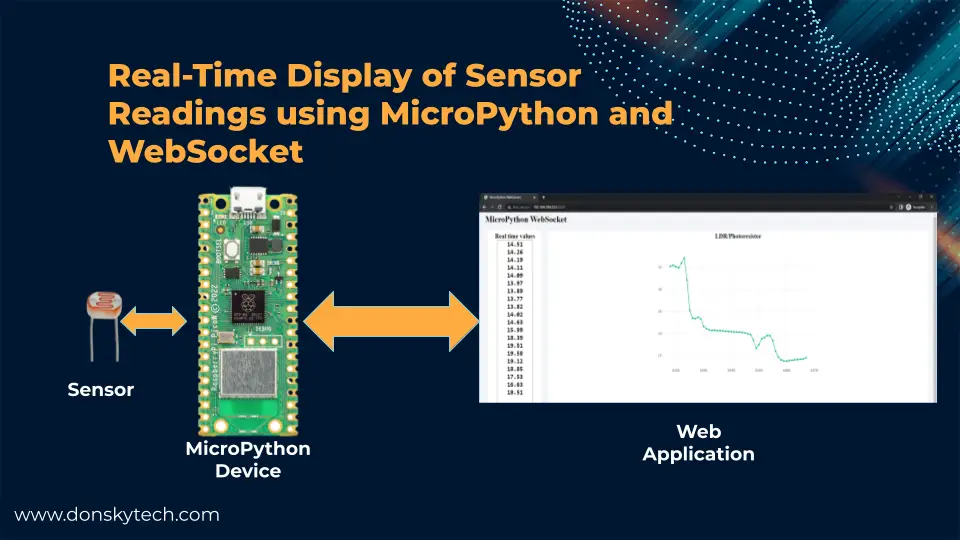
This post will show you how you can implement your own WebSocket server using the MicroDot web framework and your MicroPython device. We will capture the sensor readings and display them in almost real-time using a web application that communicates through WebSocket.
If you want to see a demo of the project then please see the below video or watch it on my YouTube channel.
What we are building?
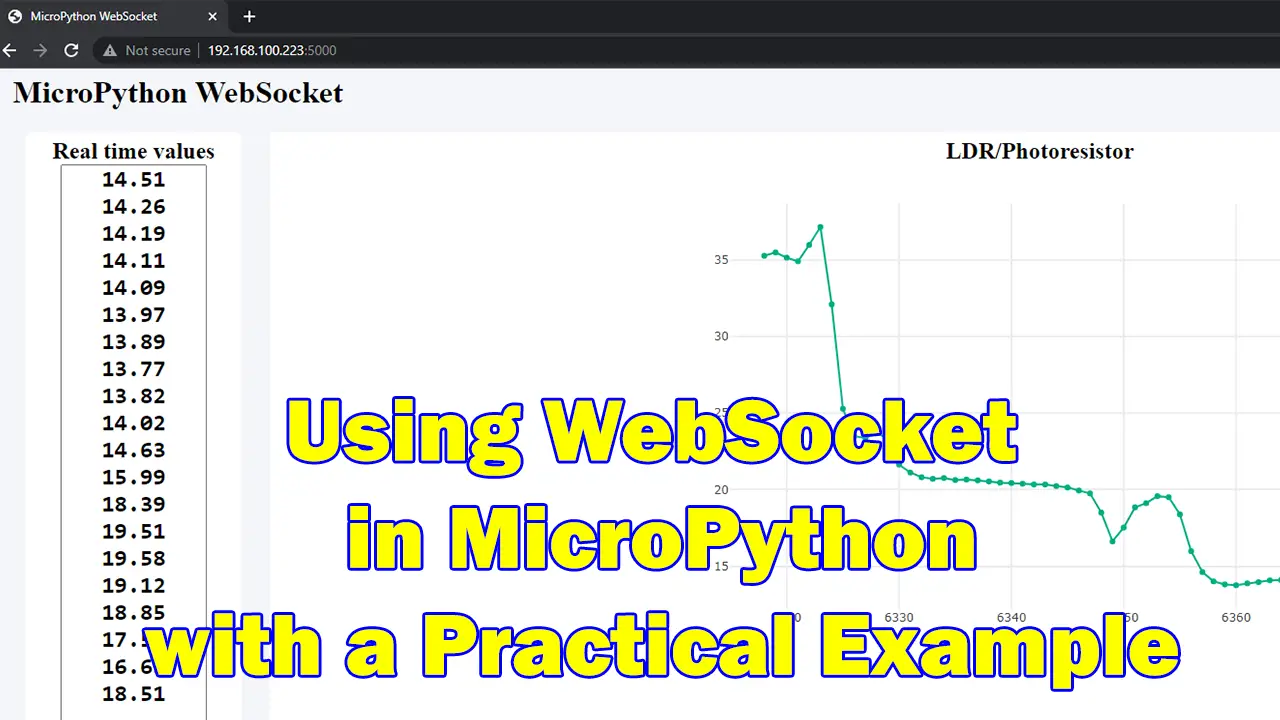
The below image is what our Web Application looks like and how it is able to display the sensor readings in almost real-time.
I have chosen a sensor that changes instantaneously like the Light Dependent Resistor (LDR) or Photoresistor and we will interface with it through our MicroPython device. We will create a web application that will display the sensor readings by talking to our MicroPython device through WebSocket.
So what are we trying to solve in this project?
The goal of this post is to try to answer the following questions:
- How do we create a WebSocket server in MicroPython?
- How can we use WebSocket to display real-time sensor readings in MicroPython?
If you are unsure what WebSocket is then please see the below post that I have written that will explain how it can help you in your Internet of Things (IoT) project.
Related Content:
Using WebSocket in the Internet of Things (IoT) projects
Project Design
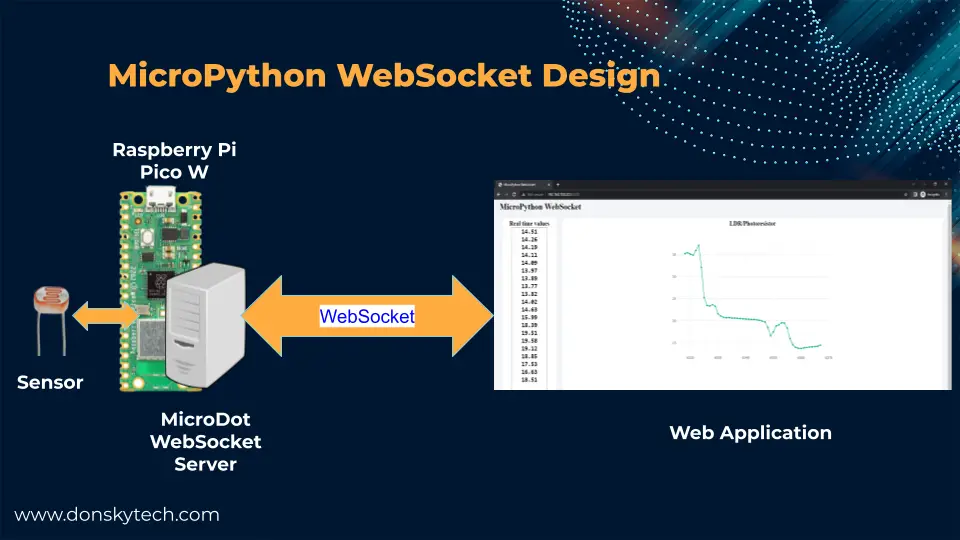
The above image is the overall design of our project. Inside our MicroPython device is a WebSocket server built using MicroDot web framework. The MicroDot application will create a web application that will display the sensor readings through a graph and a running display of sensor readings updated in real time. The web application and our MicroDot application will communicate through WebSocket.
The graphical chart is built using Plotly.js and will be asynchronously updated through Javascript.
Why use WebSocket?
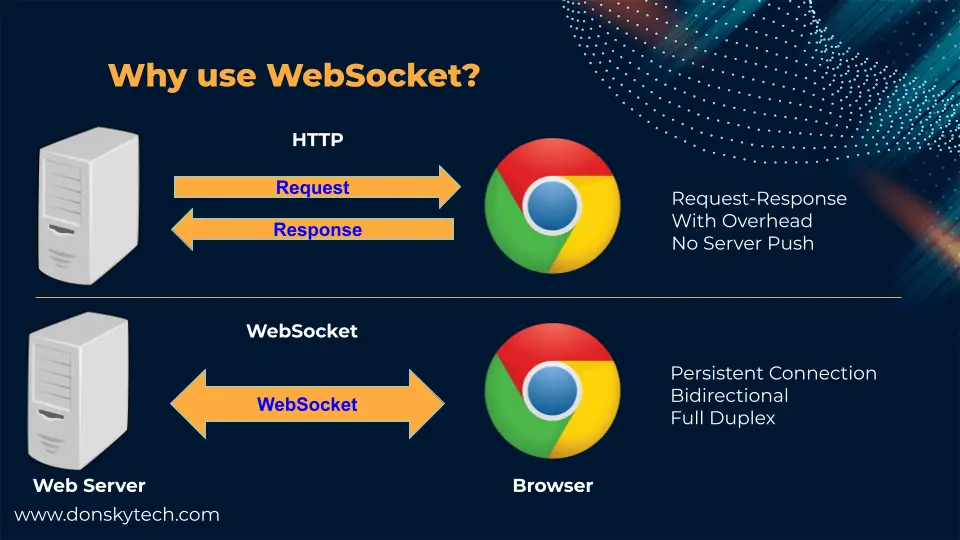
The WebSocket protocol is mainly used when you need to display real-time data between your client and your server. Applications that use the WebSocket include Stock Market or Bitcoin trading, chat applications, or manufacturing monitoring systems.
The HTTP protocol is widely used in web applications but it suffers from serious overhead problems when it needs to send continuous data because of its architecture. HTTP by default has a request-response architecture and it cannot maintain a connection with the clients connected through it. At the same time, it cannot push data coming from the server as there is no persistent connection making it hard to use in real-time applications.
This is where WebSocket was developed as it can maintain a persistent connection and is full-duplex and bidirectional. This means that server data can be pushed to connected clients and clients can reply back simultaneously making it ideal for real-time communications.
Parts/Components Required
Below are the parts or components needed to follow along with this post.
- Raspberry Pi Pico W – Amazon | AliExpress
- LDR or Photoresistor – Amazon | AliExpress
- Resistor – Amazon | AliExpress | Bangood
- Breadboard – Amazon | AliExpress | Bangood
- Connecting Wires – Amazon | AliExpress | Bangood
Disclosure: These are affiliate links and I will earn small commissions to support my site when you buy through these links.
Prerequisites
Before you proceed you should make sure that you are familiar with how to set up a web server application on your MicroPython device using the MicroDot framework. If you don’t know Microdot then please see the following posts that I have written that could get you started.
Related Content:
Develop MicroPython Application using MicroDot
How to create a MicroPython Web Server the easy way!
Also, you should have installed the latest MicroPython firmware on your device.
Related Content:
How to Install MicroPython firmware on Raspberry Pi Pico?
How to install MicroPython on ESP32 and download firmware
Lastly, I have used Thonny IDE in developing this project.
Related Content:
MicroPython Development Using Thonny IDE
How to guides in Thonny IDE using MicroPython
Wiring/Schematic
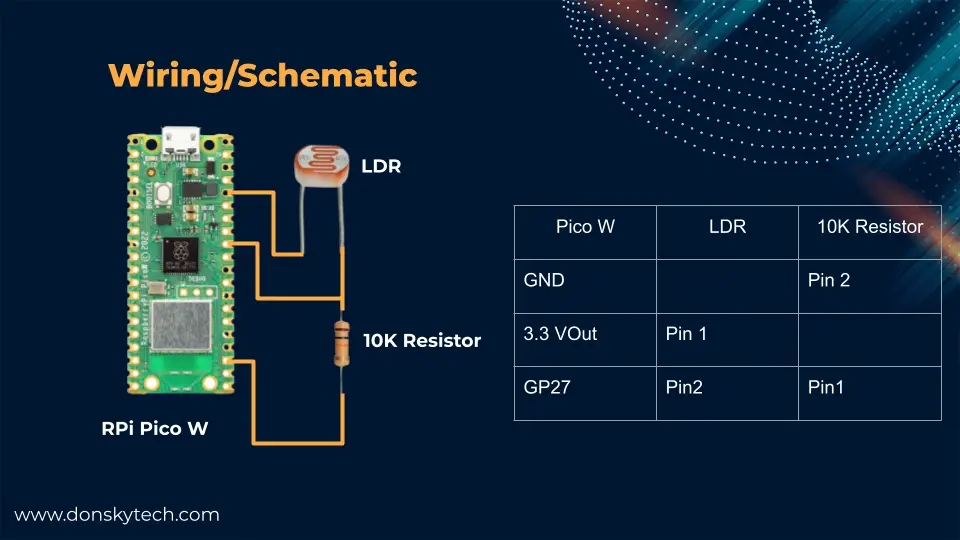
The above image will show how you can connect your LDR or Photoresistor with your MicroPython device. As you can see, we are creating a voltage divider circuit with the LDR and the 10KOhm resistor. We then connect our GP27 (or any other ADC Pin) to the connection between the LDR and the resistor.
If you are not familiar with how to read an LDR or photoresistor with your MicroPython device then please see the below post.
Related Content:
MicroPython – Read LDR or Photoresistor
Code
The complete code for this project is available on my GitHub repository which you can download as a zip file or clone it using Git.
git clone https://github.com/donskytech/micropython-raspberry-pi-pico
cd websocket_using_microdot
Once downloaded then open the project in your Thonny IDE.
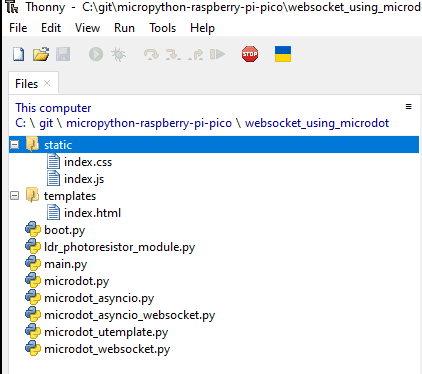
Let us scan through the parts of this MicroPython project that display real-time sensor information using WebSocket.
- ldr_photo_resistor_module.py – represents our LDR component and has a method that will return the sensor value in percentage.
- boot.py – used to connect to our WiFi network during startup
- main.py – contains our MicroDot web server and web socket application
- template/index.html – displays our user interface such as the real-time values and the chart.
- static/index.js, static/index.css – the javascript file that will create our WebSocket connection and the Cascading Style Sheet (CSS) that will stylize our page.
- microdot* – MicroDot specific files.
I will try to explain the code for each file.
ldr_photo_resistor_module.py
import machine

class LDR:
    def __init__(self, pin):
        self.ldr_pin = machine.ADC(machine.Pin(pin))

    def get_raw_value(self):
        return self.ldr_pin.read_u16()

    def get_light_percentage(self):
        return round(self.get_raw_value()/65535*100,2)
We used this file to model our LDR or Photoresistor in our program. We created a LDR class to represent our component and it contains methods that will return the sensor readings. The get_light_percentage() function will return the sensor reading in terms of percentage from 0-100%.
boot.py
# boot.py -- run on boot-up
import network

# Replace the following with your WIFI Credentials
SSID = "<PLACE_YOUR_SSID_HERE>"
SSI_PASSWORD = "<PLACE_YOUR_WIFI_PASWORD_HERE>"

def do_connect():
    import network
    sta_if = network.WLAN(network.STA_IF)
    if not sta_if.isconnected():
        print('connecting to network...')
        sta_if.active(True)
        sta_if.connect(SSID, SSI_PASSWORD)
        while not sta_if.isconnected():
            pass
    print('Connected! Network config:', sta_if.ifconfig())

print("Connecting to your wifi...")
do_connect()
This is the standard MicroPython file that gets executed during the restart of the device and we used this to connect to our WiFi network.
# Replace the following with your WIFI Credentials
SSID = "<PLACE_YOUR_SSID_HERE>"
SSI_PASSWORD = "<PLACE_YOUR_WIFI_PASWORD_HERE>"
Remember to change the two variables to match your network credentials.
main.py
The main.py contains our MicroPython MicroDot WebSocket server and handles the reading of the LDR sensor and sending the values to our user interface.
from microdot_asyncio import Microdot, Response, send_file
from microdot_utemplate import render_template
from microdot_asyncio_websocket import with_websocket
from ldr_photoresistor_module import LDR
import time

# Initialize MicroDot
app = Microdot()
Response.default_content_type = 'text/html'

# LDR module
ldr = LDR(27)

# root route
@app.route('/')
async def index(request):
    return render_template('index.html')


@app.route('/ws')
@with_websocket
async def read_sensor(request, ws):
    while True:
#         data = await ws.receive()
        time.sleep(.1)
        await ws.send(str(ldr.get_light_percentage()))

# Static CSS/JSS
@app.route("/static/<path:path>")
def static(request, path):
    if ".." in path:
        # directory traversal is not allowed
        return "Not found", 404
    return send_file("static/" + path)


# shutdown
@app.get('/shutdown')
def shutdown(request):
    request.app.shutdown()
    return 'The server is shutting down...'


if __name__ == "__main__":
    try:
        app.run()
    except KeyboardInterrupt:
        pass
Let’s go through what each line of code does.
from microdot_asyncio import Microdot, Response, send_file
from microdot_utemplate import render_template
from microdot_asyncio_websocket import with_websocket
from ldr_photoresistor_module import LDR
import time
Import the necessary packages needed to run a MicroDot web server.
# Initialize MicroDot
app = Microdot()
Response.default_content_type = 'text/html'

# LDR module
ldr = LDR(27)
Create a MicroDot web server and initialize an instance of a LDR class.
# root route
@app.route('/')
async def index(request):
    return render_template('index.html')


@app.route('/ws')
@with_websocket
async def read_sensor(request, ws):
    while True:
#         data = await ws.receive()
        time.sleep(.1)
        await ws.send(str(ldr.get_light_percentage()))
Create our index route that will serve our index.html template and our MicroPython WebSocket route that will receive and send WebSocket messages. Currently, our code is only sending the readings of our LDR or photoresistor and we are not expecting any WebSocket messages coming from our client.
The ws.send(ldr.get_light_percentage()) function will send the WebSocket message to all our clients. I have added a temporary sleep to give way for the Raspberry Pi Pico W internal code to run and not hug the whole memory.
# Static CSS/JSS
@app.route("/static/<path:path>")
def static(request, path):
    if ".." in path:
        # directory traversal is not allowed
        return "Not found", 404
    return send_file("static/" + path)


# shutdown
@app.get('/shutdown')
def shutdown(request):
    request.app.shutdown()
    return 'The server is shutting down...'


if __name__ == "__main__":
    try:
        app.run()
    except KeyboardInterrupt:
        pass
The first route will serve our static files such as our index.css and index.js. The second route will shut down our MicroDot server. The last part of the code will just run our MicroDot web server.
templates/index.html
<!DOCTYPE html>
<html lang="en">
  <head>
    <meta charset="UTF-8" />
    <meta name="viewport" content="width=device-width, initial-scale=1.0" />
    <meta http-equiv="X-UA-Compatible" content="ie=edge" />
    <title>MicroPython WebSocket</title>
    <link rel="stylesheet" href="static/index.css" />
    <link rel="icon" href="./favicon.ico" type="image/x-icon" />
    <script src="https://cdn.plot.ly/plotly-2.16.1.min.js"></script>
  </head>
  <body>
    <h1>MicroPython WebSocket</h1>
    <div class="container">
      <aside>
        <h2>Real time values</h2>
        <textarea
          id="sensor-values"
          name=""
          class="values"
          cols="10"
          rows="20"
        ></textarea>
      </aside>
      <main class="chart">
        <h2>LDR/Photoresistor</h2>
        <div class="wrapper">
          <div id="sensor-chart" class="sensor-chart"></div>
        </div>
      </main>
    </div>
    <script src="static/index.js"></script>
  </body>
</html>
This is our HTML user interface that will display the current sensor readings from our LDR or PhotoResistor.
<!DOCTYPE html>
<html lang="en">
  <head>
    <meta charset="UTF-8" />
    <meta name="viewport" content="width=device-width, initial-scale=1.0" />
    <meta http-equiv="X-UA-Compatible" content="ie=edge" />
    <title>MicroPython WebSocket</title>
    <link rel="stylesheet" href="static/index.css" />
    <link rel="icon" href="./favicon.ico" type="image/x-icon" />
    <script src="https://cdn.plot.ly/plotly-2.16.1.min.js"></script>
  </head>
The head section defines some of our meta attributes and the title. We import also the index.css stylesheet and the Plotly.js for drawing the chart.
<body>
    <h1>MicroPython WebSocket</h1>
    <div class="container">
      <aside>
        <h2>Real time values</h2>
        <textarea
          id="sensor-values"
          name=""
          class="values"
          cols="10"
          rows="20"
        ></textarea>
      </aside>
      <main class="chart">
        <h2>LDR/Photoresistor</h2>
        <div class="wrapper">
          <div id="sensor-chart" class="sensor-chart"></div>
        </div>
      </main>
    </div>
    <script src="static/index.js"></script>
  </body>
</html>
We define an HTML textarea at the left-hand side of the screen to display the current sensor readings and the HTML div that will display our Plotly.js chart. After which, we import index.js at the end of the body section.
static/index.js
const sensorValues = document.querySelector("#sensor-values");

const sensorData = [];

/*
  Plotly.js graph and chart setup code
*/
var sensorChartDiv = document.getElementById("sensor-chart");

// History Data
var sensorTrace = {
  x: [],
  y: [],
  name: "LDR/Photoresistor",
  mode: "lines+markers",
  type: "line",
};

var sensorLayout = {
  autosize: false,
  width: 800,
  height: 500,
  colorway: ["#05AD86"],
  margin: { t: 40, b: 40, l: 80, r: 80, pad: 0 },
  xaxis: {
    gridwidth: "2",
    autorange: true,
  },
  yaxis: {
    gridwidth: "2",
    autorange: true,
  },
};
var config = { responsive: true };

Plotly.newPlot(sensorChartDiv, [sensorTrace], sensorLayout, config);

// Will hold the sensor reads
let newSensorXArray = [];
let newSensorYArray = [];

// The maximum number of data points displayed on our scatter/line graph
let MAX_GRAPH_POINTS = 50;
let ctr = 0;

function updateChart(sensorRead) {
  if (newSensorXArray.length >= MAX_GRAPH_POINTS) {
    newSensorXArray.shift();
  }
  if (newSensorYArray.length >= MAX_GRAPH_POINTS) {
    newSensorYArray.shift();
  }
  newSensorXArray.push(ctr++);
  newSensorYArray.push(sensorRead);

  var data_update = {
    x: [newSensorXArray],
    y: [newSensorYArray],
  };

  Plotly.update(sensorChartDiv, data_update);
}

// WebSocket support
var targetUrl = `ws://${location.host}/ws`;
var websocket;
window.addEventListener("load", onLoad);

function onLoad() {
  initializeSocket();
}

function initializeSocket() {
  console.log("Opening WebSocket connection MicroPython Server...");
  websocket = new WebSocket(targetUrl);
  websocket.onopen = onOpen;
  websocket.onclose = onClose;
  websocket.onmessage = onMessage;
}
function onOpen(event) {
  console.log("Starting connection to WebSocket server..");
}
function onClose(event) {
  console.log("Closing connection to server..");
  setTimeout(initializeSocket, 2000);
}
function onMessage(event) {
  console.log("WebSocket message received:", event);
  updateValues(event.data);
  updateChart(event.data);
}

function sendMessage(message) {
  websocket.send(message);
}

function updateValues(data) {
  sensorData.unshift(data);
  if (sensorData.length > 20) sensorData.pop();
  sensorValues.value = sensorData.join("\r\n");
}
Most of the functionality of our page is done by this file so it is important to discuss what each line of the code does.
const sensorValues = document.querySelector("#sensor-values");
const sensorData = [];

/*
  Plotly.js graph and chart setup code
*/
var sensorChartDiv = document.getElementById("sensor-chart");
We declare the HTML elements that will contain our chart and what will show the latest readings from our sensor.
// History Data
var sensorTrace = {
  x: [],
  y: [],
  name: "LDR/Photoresistor",
  mode: "lines+markers",
  type: "line",
};

var sensorLayout = {
  autosize: false,
  width: 800,
  height: 500,
  colorway: ["#05AD86"],
  margin: { t: 40, b: 40, l: 80, r: 80, pad: 0 },
  xaxis: {
    gridwidth: "2",
    autorange: true,
  },
  yaxis: {
    gridwidth: "2",
    autorange: true,
  },
};
var config = { responsive: true };

Plotly.newPlot(sensorChartDiv, [sensorTrace], sensorLayout, config);
This is our Plotly.js configuration for our line chart. The following are needed in order to draw the line chart trace.
// Will hold the sensor reads
let newSensorXArray = [];
let newSensorYArray = [];

// The maximum number of data points displayed on our scatter/line graph
let MAX_GRAPH_POINTS = 50;
let ctr = 0;

function updateChart(sensorRead) {
  if (newSensorXArray.length >= MAX_GRAPH_POINTS) {
    newSensorXArray.shift();
  }
  if (newSensorYArray.length >= MAX_GRAPH_POINTS) {
    newSensorYArray.shift();
  }
  newSensorXArray.push(ctr++);
  newSensorYArray.push(sensorRead);

  var data_update = {
    x: [newSensorXArray],
    y: [newSensorYArray],
  };

  Plotly.update(sensorChartDiv, data_update);
}
We are saving our LDR or Photoresistor readings in the storage arrays newSensorXArray and newSensorYArray. We are only saving the last 50 readings. The function updateChart() will update our arrays. It checks if the maximum readings were reached and if yes then it drops the last record and saves the new one to our storage arrays. Lastly, it updates our charts to display the storage arrays in our chart.
// WebSocket support
var targetUrl = `ws://${location.host}/ws`;
var websocket;
window.addEventListener("load", onLoad);

function onLoad() {
  initializeSocket();
}

function initializeSocket() {
  console.log("Opening WebSocket connection MicroPython Server...");
  websocket = new WebSocket(targetUrl);
  websocket.onopen = onOpen;
  websocket.onclose = onClose;
  websocket.onmessage = onMessage;
}
function onOpen(event) {
  console.log("Starting connection to WebSocket server..");
}
function onClose(event) {
  console.log("Closing connection to server..");
  setTimeout(initializeSocket, 2000);
}
function onMessage(event) {
  console.log("WebSocket message received:", event);
  updateValues(event.data);
  updateChart(event.data);
}

function sendMessage(message) {
  websocket.send(message);
}

function updateValues(data) {
  sensorData.unshift(data);
  if (sensorData.length > 20) sensorData.pop();
  sensorValues.value = sensorData.join("\r\n");
}
These are our WebSocket handling logic wherein we connect to our MicroDot WebSocket server. We declare several callback functions that would be called whenever an event occurred in our WebSocket connection.
The important callback is the onMessage() which handles the WebSocket message coming from our MicroDot MicroPython web server. Upon receiving a message we update our chart and the list of current values.
static/index.css
:root {
  --color-white: #fff;
  --color-dark-variant: #f3f5f8;
  --border-radius-1: 0.4rem;
}

* {
  margin: 0;
  padding: 0;
  outline: 0;
}

body {
  width: 100vw;
  height: 100vh;
  overflow-x: hidden;
  background: var(--color-dark-variant);
}
h1 {
  margin-top: 0.4rem;
  margin-left: 1.6rem;
}

.container {
  display: grid;
  width: 96%;
  margin: 0 auto;
  gap: 1.8rem;
  grid-template-columns: 14rem auto;
}
aside {
  margin-top: 1.4rem;
  height: 100vh;
  background: var(--color-white);
  border-radius: var(--border-radius-1);
  padding: 0.4rem;
  display: flex;
  flex-direction: column;
  align-items: center;
  justify-content: center;
}
.values {
  text-align: center;
  resize: none;
  height: 100%;
  font-size: 1.5rem;
  font-weight: bold;
}

main {
  margin-top: 1.4rem;
  background: var(--color-white);
  padding: 0.4rem;
  /* border: 1px solid red; */
  text-align: center;
}

.wrapper {
  display: flex;
  align-items: center;
  justify-content: center;
}
These are our minimal stylesheet classes that will beautify our page. I won’t be discussing so much about this code as these are standard CSS stylesheets.
microdot*
Files that start with microdot are MicroDot-specific files which I have just copied from the project source file here.
How to run the project?
First, install the utemplate library on your MicroPython device using your Thonny IDE. You can check the steps on how this is done in How to install MicroPython libraries or packages in Thonny IDE?
Next, edit the boot.py to match your network configuration.
Lastly, upload all the files on your MicroPython device and do a soft reboot. Once, an IP address is assigned to your Raspberry Pi Pico W then access the following URL.
http://<IP>:5000Wrap Up
We have successfully displayed our sensor readings in real-time in our MicroPython program using WebSocket in this post.
I hope you learned something! Happy Exploring!
Support Me!
I love sharing what I know and hopefully, I was able to help you. Writing helpful content takes so much time and research. If you think you like my work and I have managed to help you then please consider supporting my channel. I would be very grateful and would boost my confidence that what I am doing is making a big change in the world. (No Pun Intended!) 😉
Become a Patron!
Leave a Reply